

Introduction
Modelling of the Mining System
Numerical Method for CFD
Design of Experiments
Results and Discussion
Simulation results of lifting pump
Optimized parameters for impeller and guide vane
Predicted curve of optimized parameters for A0B0 C2D2 case
Conclusion
Introduction
The deep sea floor could be thought as the last repository of mineral resources left for mankind. Since the 1960’s, USA and Japan have actively pushed for the development of deep-sea mineral resources in preparation for the depletion of on-land mineral resources. Especially, the development of exploration, mining and transfer technologies is essential in developing deep-sea manganese nodules, of which mining technology can be distinguished by collection and lifting technologies (Chung, 1994). Yoon et al. (2010) tested the integrated the lifting and collecting technology at Hupo port of East coast of Korea. The lifting system, which conveyed manganese nodules from the seafloor to the mining ship in deep-sea mining projects, is the most important factor. The conveying system of manganese nodules can be divided into the hydraulic pumping system and the air lift system according to the dredging method of flow, the continuous line buckets system of the mechanical type and the modular marine mining automation system (Yoon et al., 2003). The hydraulic pump lifting system, one of the lifting methods, is located between the buffer system and the lifting pipe connected to the ship. To improve the efficiency of the lifting pump, many studied have been carried using CFD code (Yoon et al., 2009; Lee et al., 2010). The lifting pump of the hydraulic pump lifting system is efficient when designed with multi-stages because it requires a high hydraulic head (Park et al., 2007). Park et al. (2009) performed numerical prediction using commercial code for four-stage lifting pump. In Japan, an 8 stage lifting pump was developed for its offshore experiment (Chung, 1994).
In the present study, concentrations of manganese nodules, sea floor sediments and slurry with seawater were determined for the design of deep-sea lifting pump. Then, pipe diameters were determined after annual mining amounts were estimated when flow velocity in the pipe was set as 4.5 m/sec. When the vertical distance is 2,500 m and the horizontal distance is 100m with slurry concentration 12%, the required lifting
distance is 640 m. The design of the mixed flow pump for this purpose was estimated to require total fourteen levels, which means 46 meters per level. In addition, flow rate was calculated 20 m3/min. Then, inlet and outlet angles of the impeller and the guide vane were determined according to respective flow lines including the hub and the shroud. Then the four determined parameters were analyzed and optimized by giving them three levels respectively for each flow line according to the design of experiments.
Modelling of the Mining System
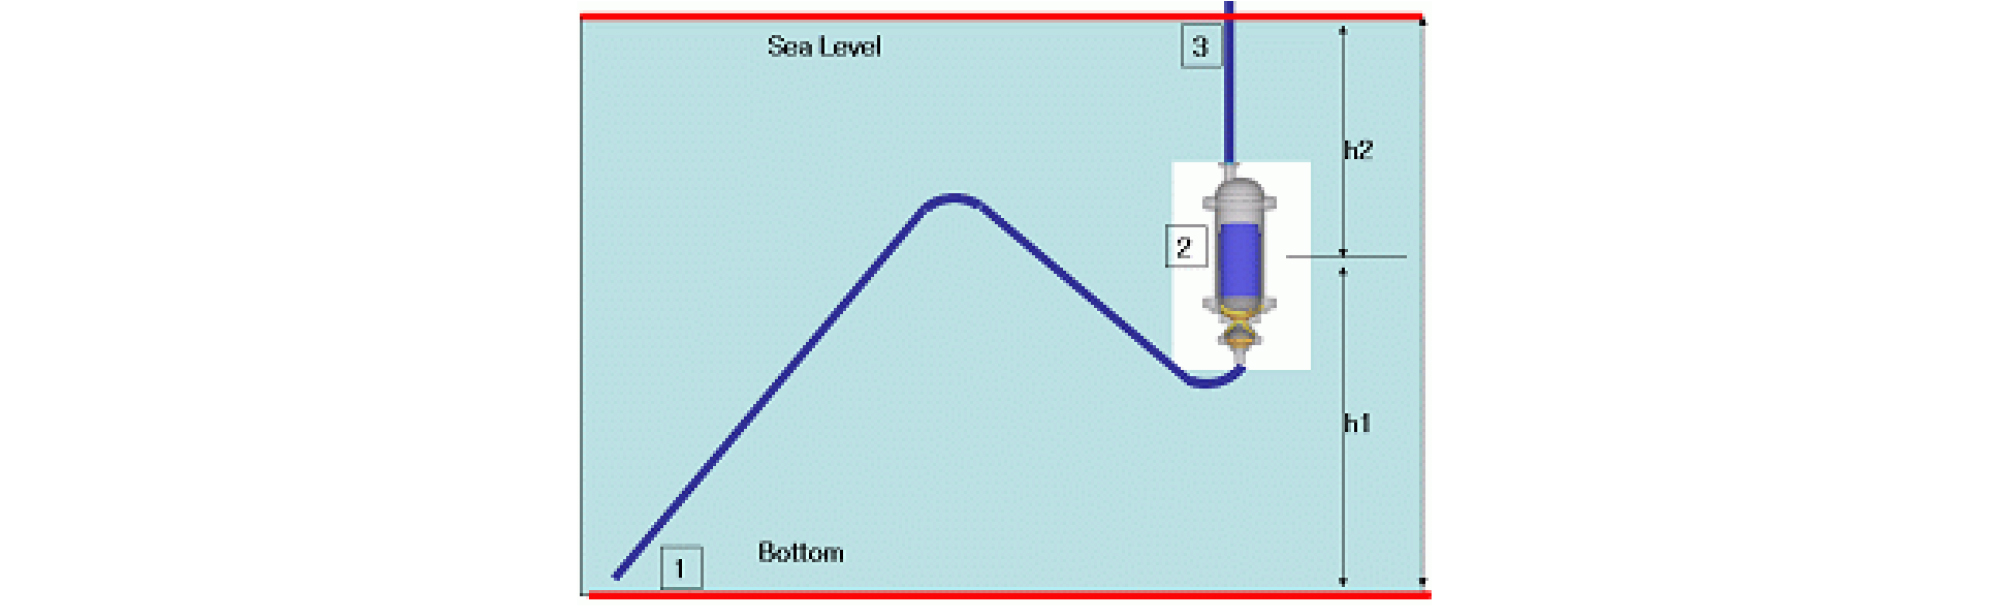
The schematics of the lifting system are shown in Fig. 1. Especially, this lifting system is composed of flexible pipe (1), lifting pump (2), and lifting pipe (3). The lifting pump is a hydrualic pump to convey manganese nodules to a surface ship. The aim of the study is to design hydraulic pumping system of a two-phase (solid and liquid) lifting technology. The simulations were performed for two purposes: the prediction of pump efficient and the total analysis of the lifting performance. For the efficiently study of total mining system, a computational fluid analysis was performed to deduce the flow characteristic value of each part. The analytical method was employed to analyze the total system.
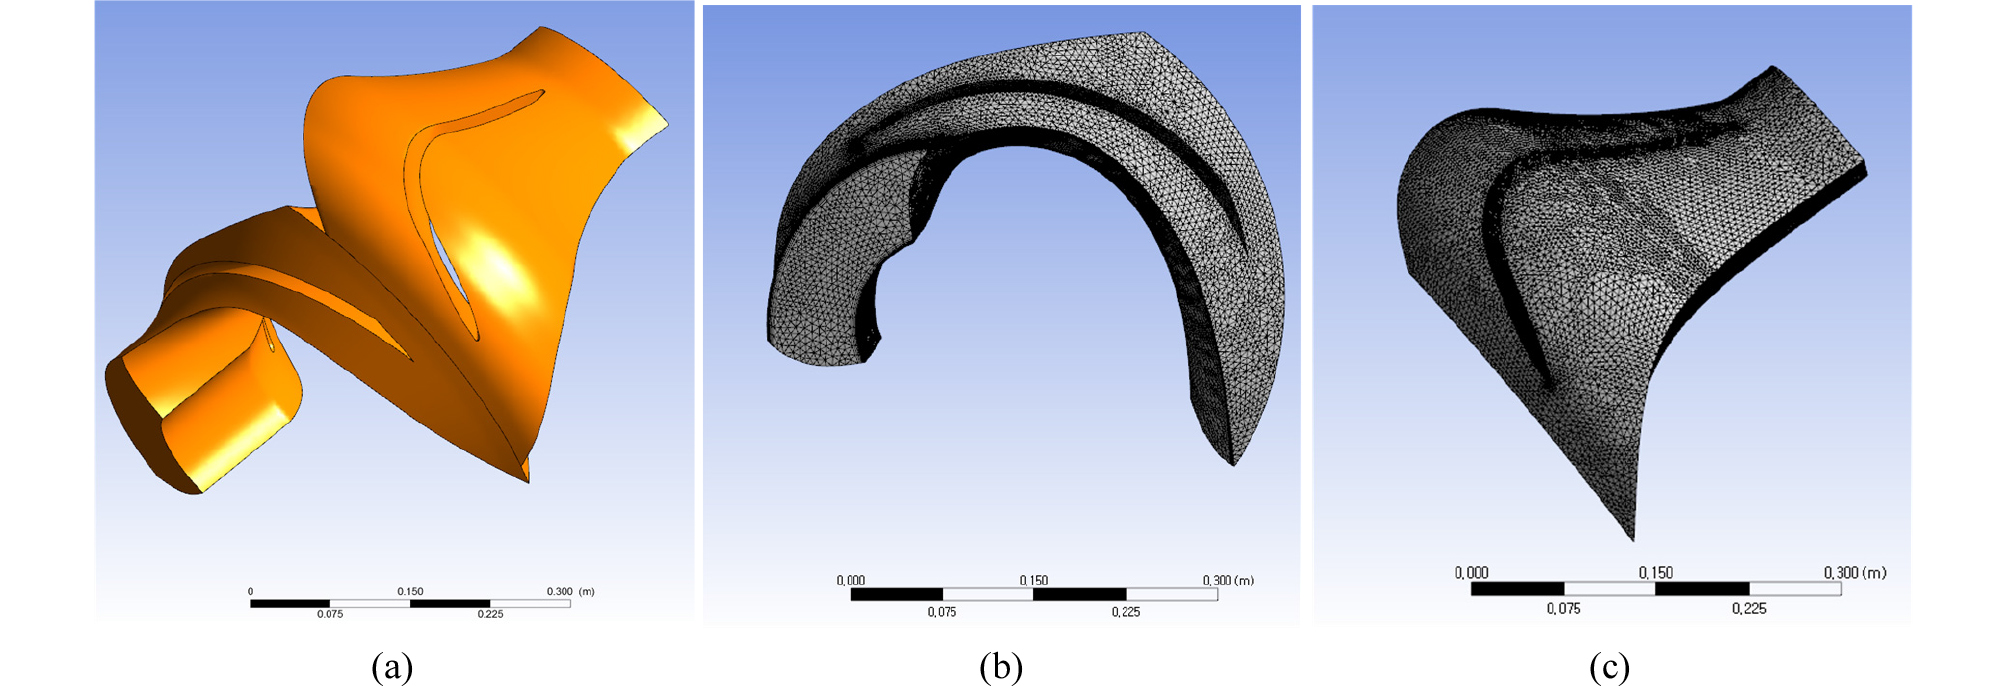
The pump was divided into two parts for computational numerical analysis as shown in Fig. 2. The first one is the impeller part which is rotating and the second one is the guided vane which is stationary.

Numerical Method for CFD
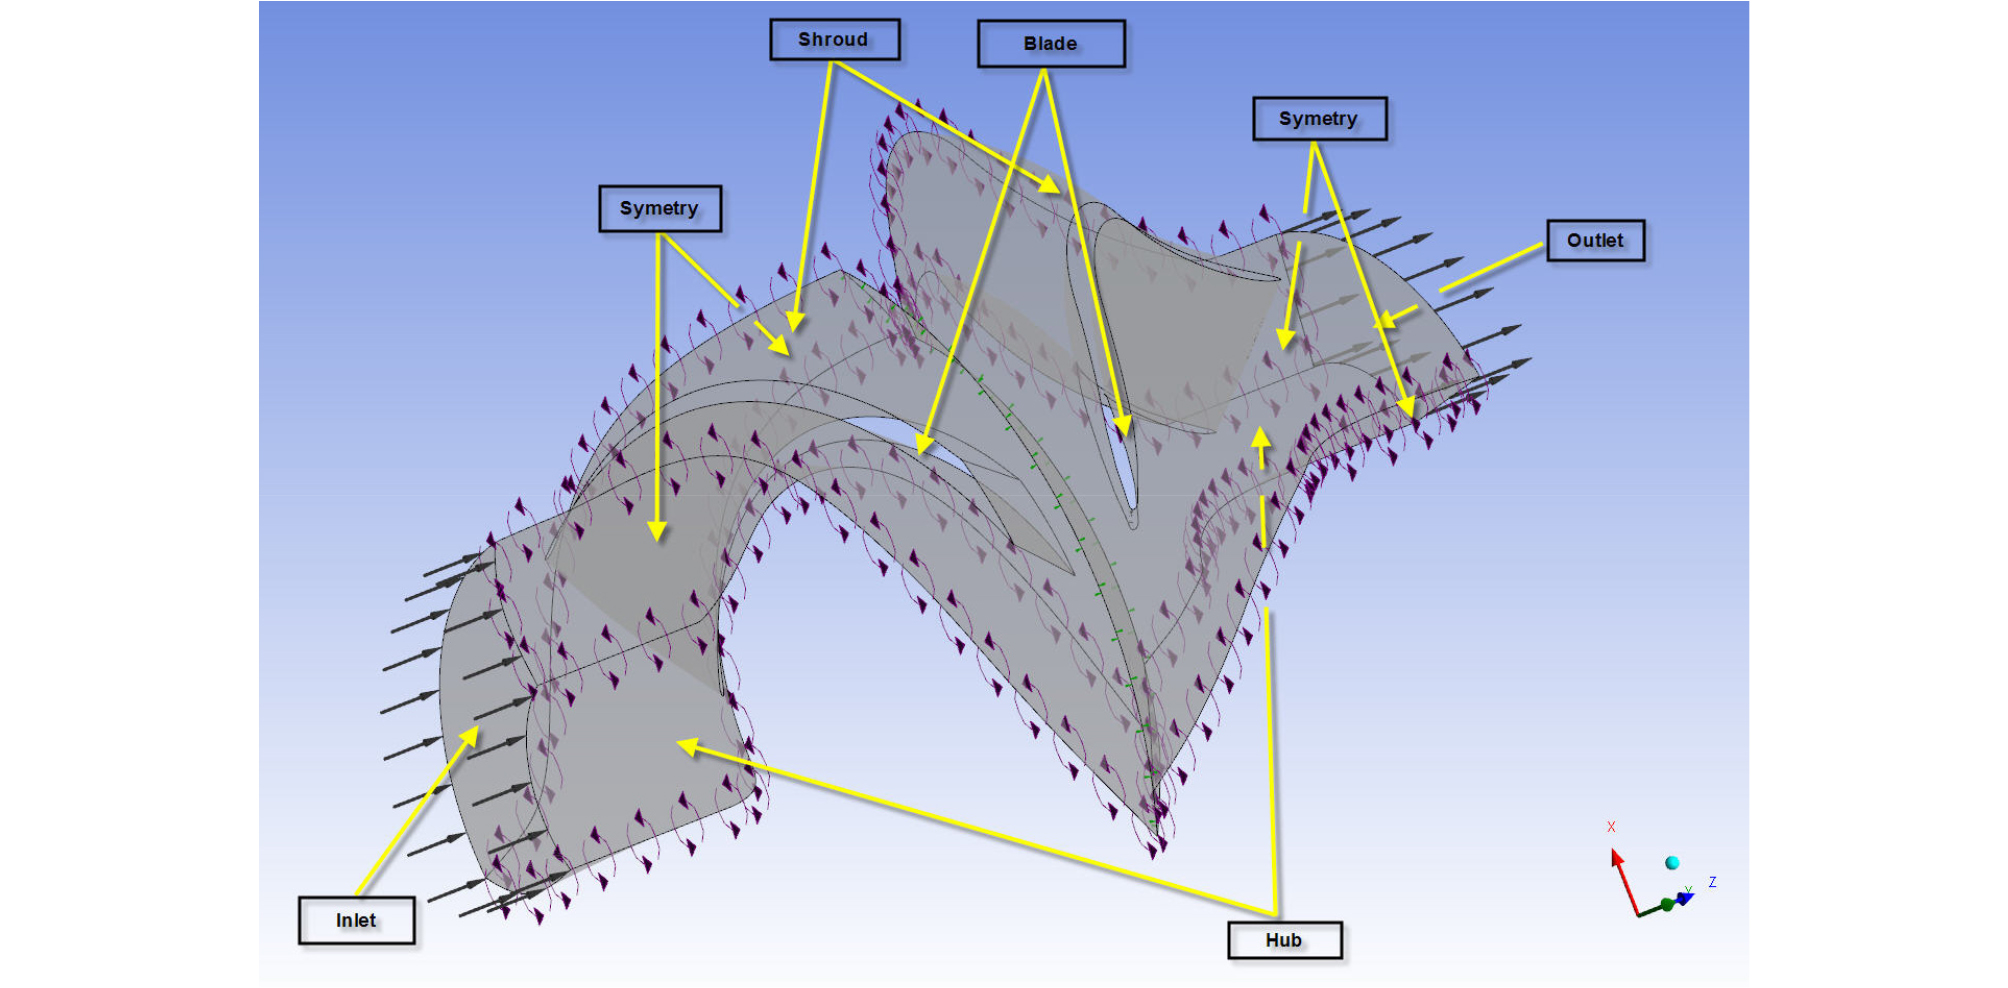
The CFD computations are conducted using the program CFX, which uses the Finite Volume Method to solve the Navier-Stokes equations to predict the flow efficiency in the pump and flexible pipes. The tetrahedral grid is employed for calculation. In the flow area, close to the wall or in the part where high gradients, are meshed with a fine grids to solve gradients with flow characteristics. In Fig. 3, the calculation grid of the pump is shown. Shear Stress Transport modeling of CFX, a kind of k-ω turbulent modeling, was employed, which is known for high adaptability to fluid mechanics analysis such as for pumps. The numbers of grid in impeller and guided vane are 650,000 and 850,000 respectively. Fig. 4 presents the boundary conditions for CFX simulations. The mixing plane model is chosen as the rotor-stator interface model.
It is not necessary to analyze all the fourteen levels because each level is repeated including the impeller and the guide vane. Therefore, the first level analysis was performed in the present study.
Design of Experiments
Inlet angle (A) and outlet angle (B) of impellers, and those (C and D) of guide vanes were calculated according to each flow line as shown in Table 1 when angles calculated from initial hydraulic design results were set as Level 1.
Table 1. Design Parameters as Initial Values
| Impeller | Guide Vane | ||||
| Inlet Angle [°] | Outlet Angle [°] | Inlet Angle [°] | Outlet angle [°] | ||
| Shroud | 19.139 | 17.530 | 22.570 | 101.106 | |
| Middle | 20.321 | 16.774 | 15.538 | 101.897 | |
| Hub | 21.503 | 16.018 | 15.413 | 101.862 | |
Actually, the impeller has four blades and the guided vane has five blades. By using periodic conditions, each one blade is employed at both impeller and guided vane. Therefore, analysis of the first stage is performed in the present study. According to the design of experiments (Park, 1986), only the neighboring alterations such as AxB, BxC or CxD were permitted and others were excluded. Parametric studies were conducted on the basis of the design of experiments.
Results and Discussion
Simulation results of lifting pump
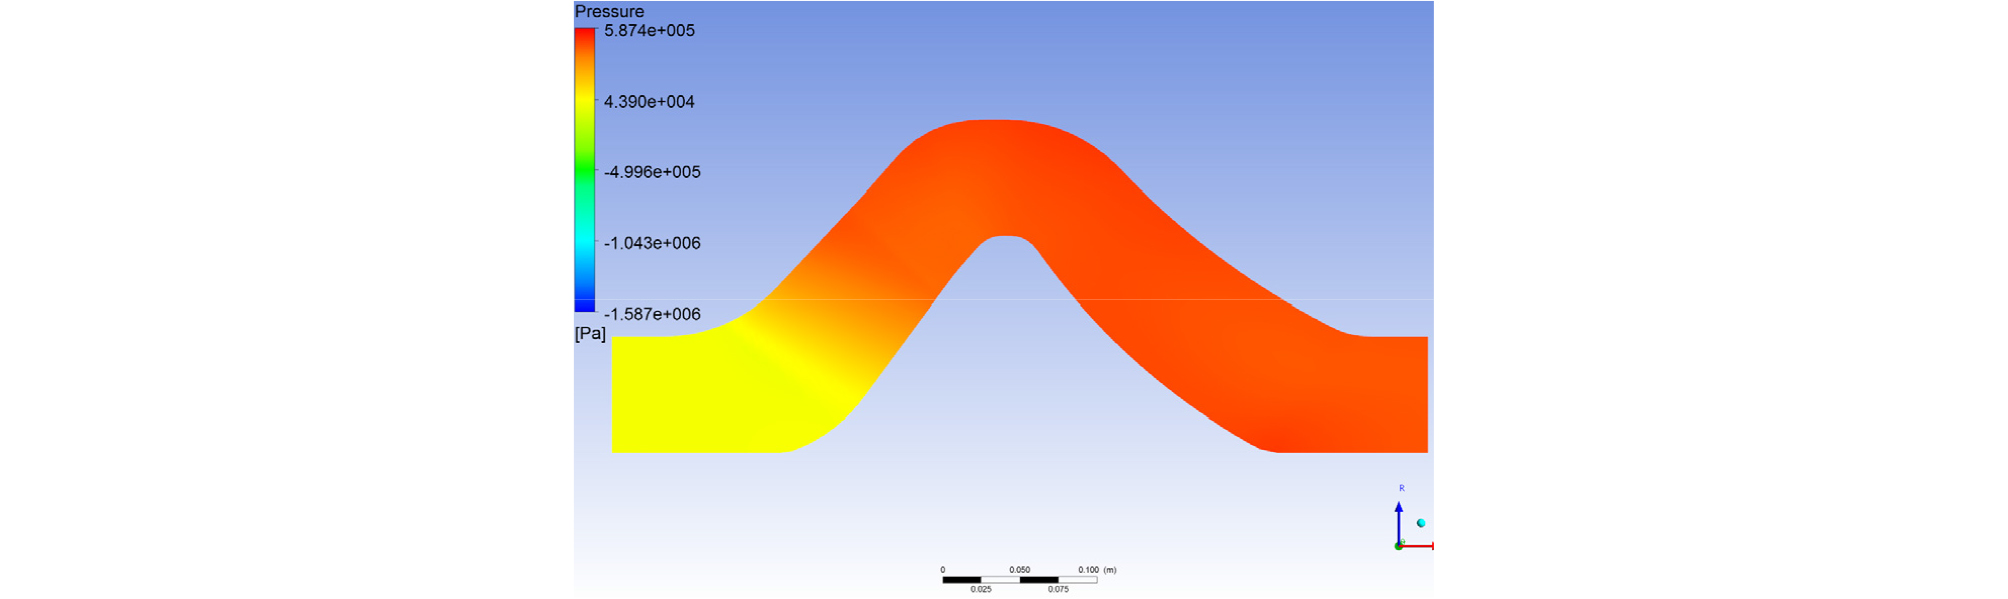
In Fig. 5 and Fig. 6, pressure and velocity distribution of the lifting pump are given. The pressure increases when flow passes through the rotor and the stator, but velocity increases at the rotor and decreases at the stator. It can also be seen that as the flow flows from the rotor exit to the stator, the total pressure increasing at the rotor decreases.
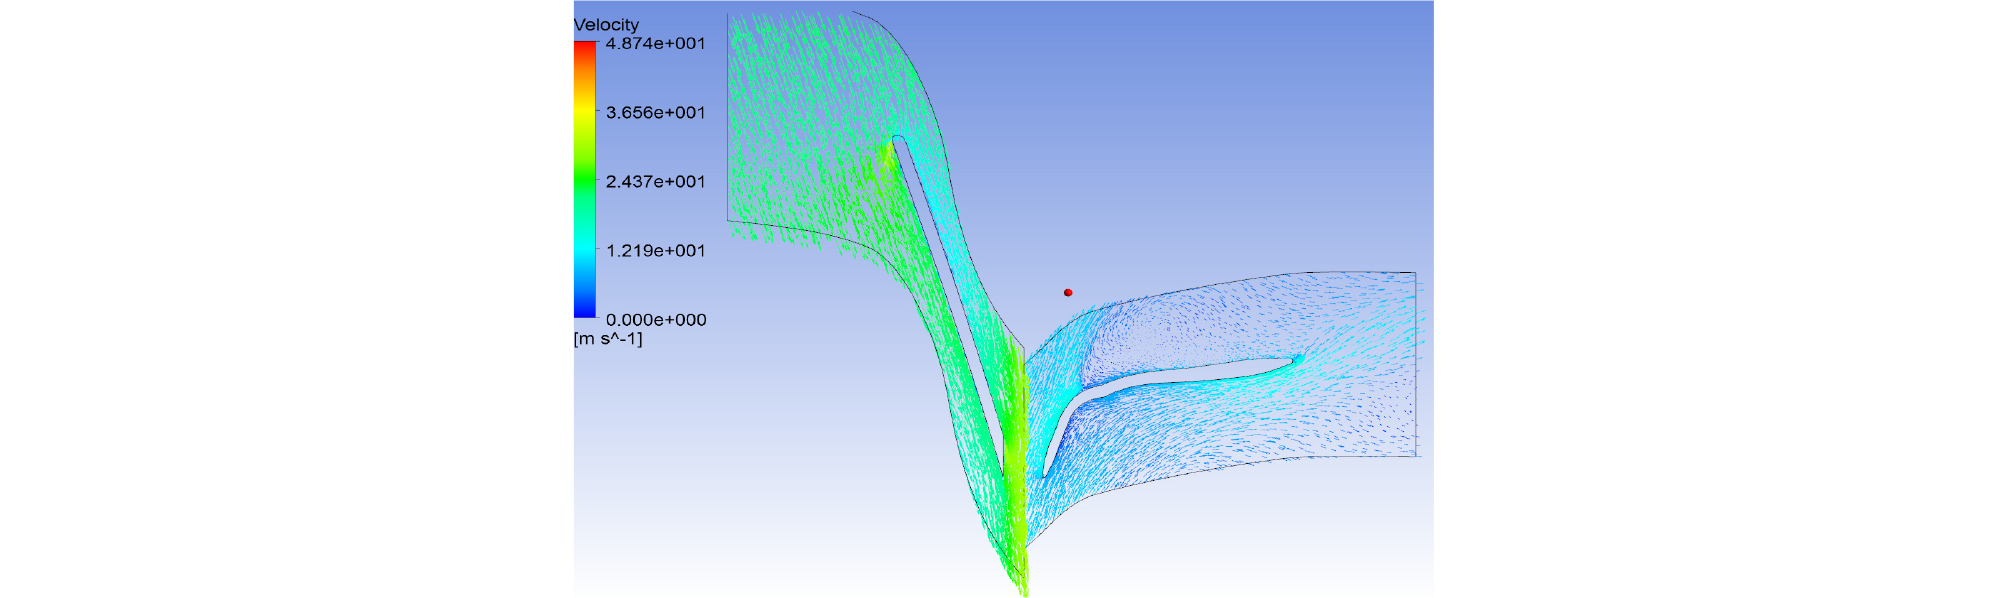
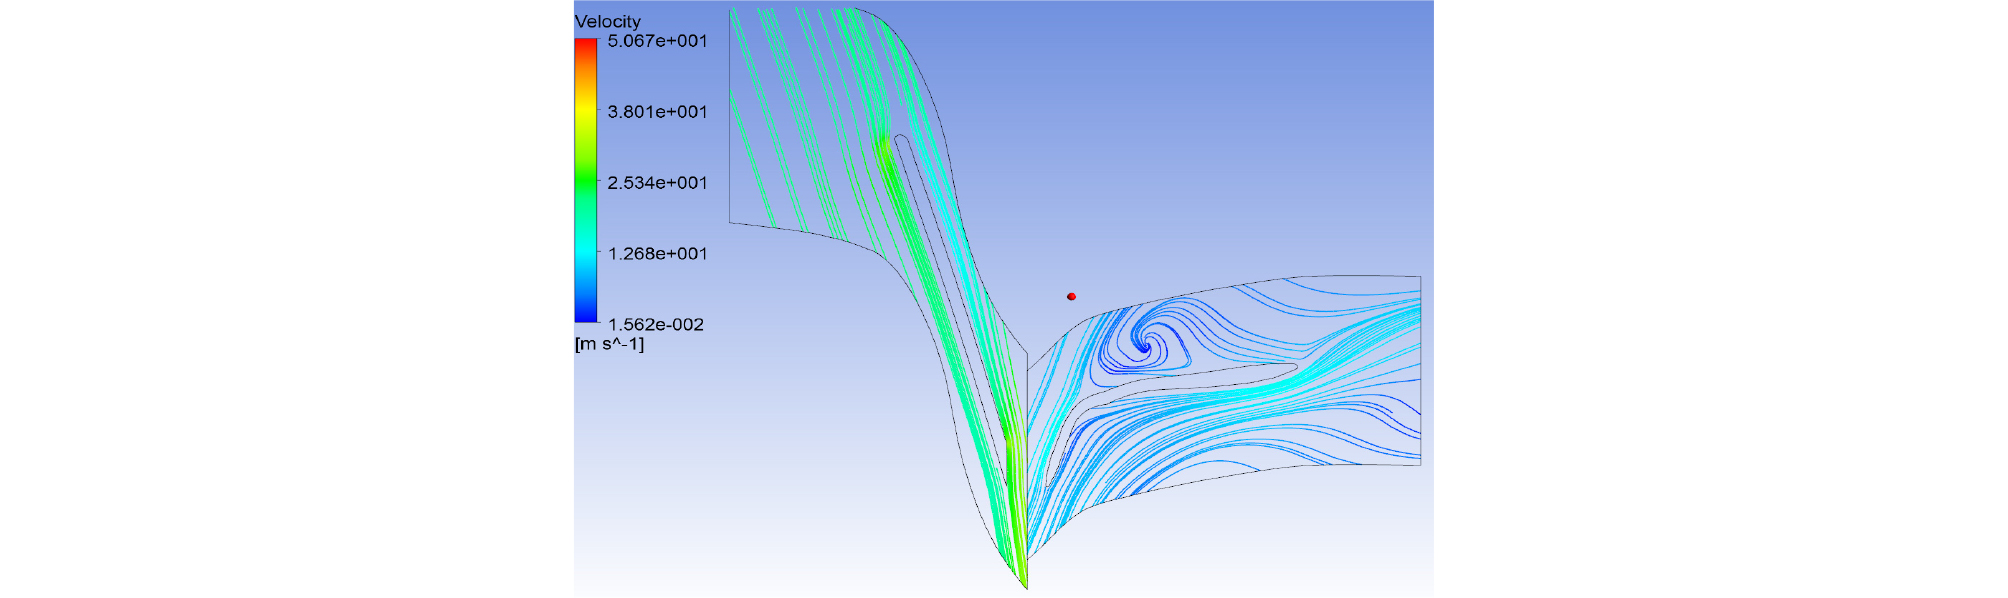
In Fig. 7, flow lines at the impeller and the guide vane are represented. The flow that is accelerated at the impeller does not flow out smoothly from the guide vane and shows considerably complex flow distribution. The flow line at the blade suction side can be predicted to form a recirculation area in the direction of span and hub side. The outer side velocity is considered to be faster because the discharge direction is toward the radius, and losses occur due to separation and vortex near the central axis. The water flow into the stator is interrupted by this vortex.
Optimized parameters for impeller and guide vane
With the deduced CFD above, optimum design parameters were deduced through the optimization process by design of experiments. As shown in Table 2, the determined optimum parameter is A0B0C2D2 which is expected to be 73.5% in efficiency while the worst one is A2B2 C1D2 which is expected to be 61.0% in efficiency, which indicates that the former is better than the latter in efficiency by more than 12.5%.
Table 2. Optimized design Parameter
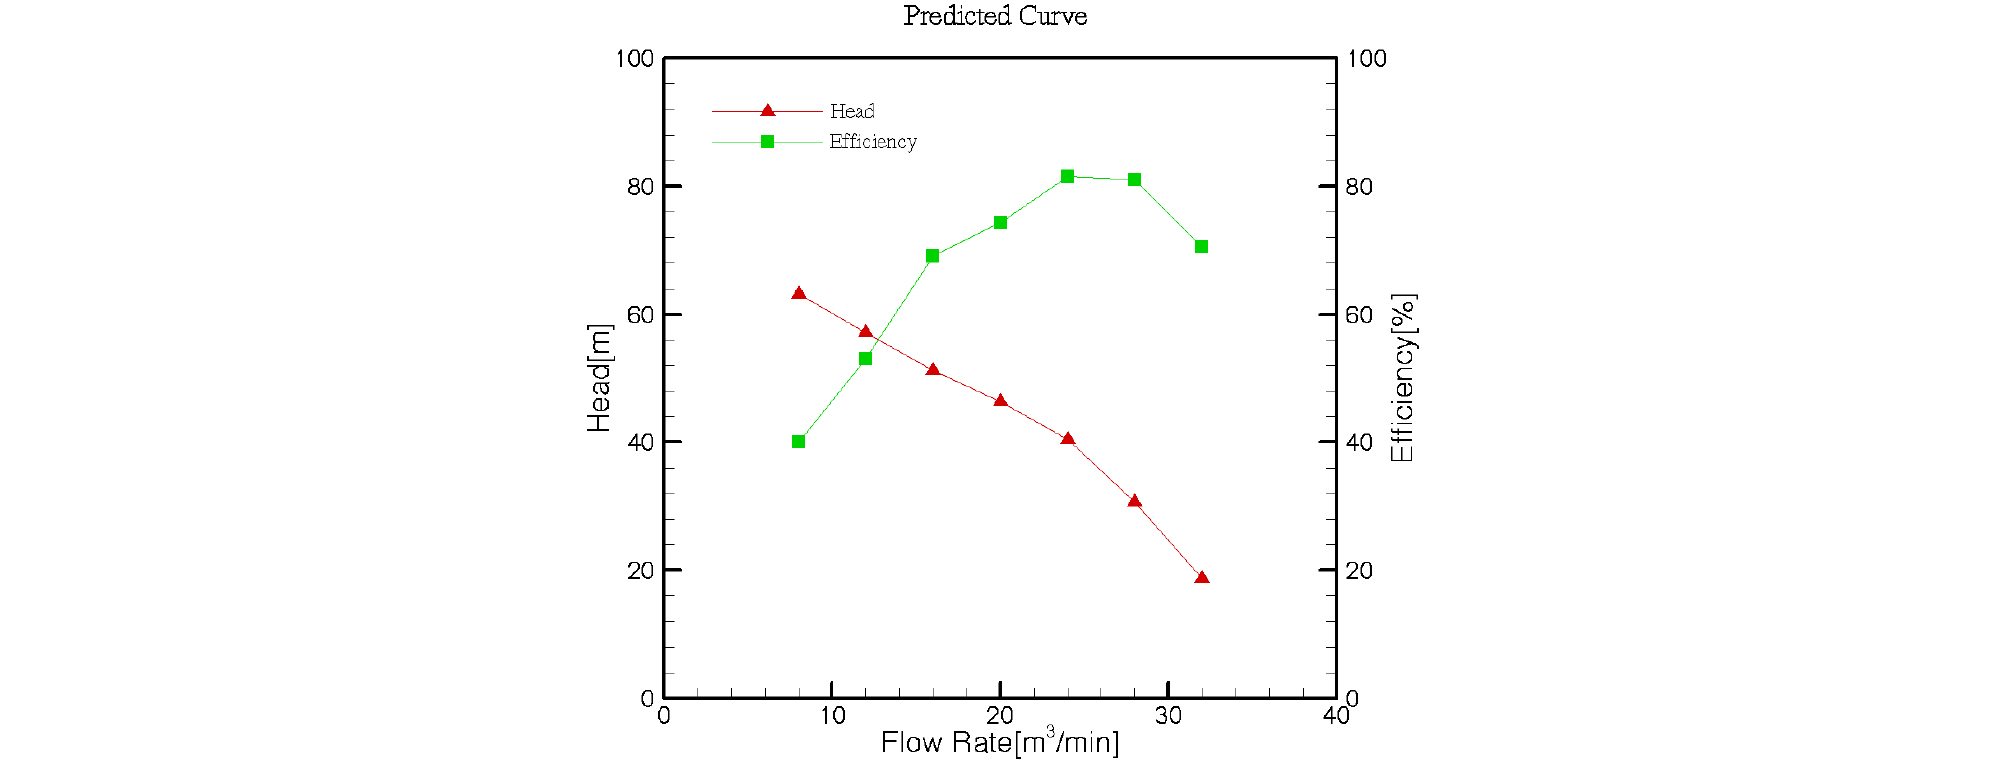
Predicted curve of optimized parameters for A0B0 C2D2 case
For A0B0C2D2 case, predicted curves of flow quantity and lifting distance were calculated on the basis of the above deduced design parameters as shown in Fig. 8, where y-axis indicates efficiency. In the figure, it is shown that the optimum efficiency is determined at 26 m3/min, which is 6 m3/min right away from 20 m3/min of the designed flow quantity.
Conclusion
Four design parameters (inlet/outlet angles of one blade of an impeller and inlet/outlet angles of one blade of a guided vane) which are deduced on the basis of the initial hydraulic design results are designed optimally by using design of experiments and CFD for hydraulic pumps to lift manganese nodules in the deep sea. CFD analyses are employed to conduct parametric studies for design optimization of impellers and guided vanes. All 12 cases are determined and analyzed for parametric studies. To produce the high efficiency (73.5%), velocities, heads, flow rates are presented. The final optimal angles of rotor and stator are calculated through the numerical simulations. The results show CFD is an excellent tool to find the optimal parametric condition of a lifting pump for lifting the mineral resources on the deep-sea seabed.
