Introduction
Theory and Methods
Maxwell’s Equations in 1-D Anisotropic Media
Analytic Solutions using the Matrix Propagation Method
Stabilization strategies for numerical computation of 1-D solutions
Stabilization strategy I
Stabilization Strategy II
Numerical Experiments
Verification of the two proposed strategies
Numerical Experiments
Conclusions
Introduction
The magnetotelluric (MT) method, which is one of the passive geophysical methods utilizing natural electromagnetic fields, has extensively been employed for various purposes, such as analysis of subsurface electrical structures, and mining, geothermal and petroleum explorations. In most cases, MT data have been interpreted under the assumption of isotropic media. However, when the electrical properties of the Earth interior are remarkably anisotropic (Liu et al., 2018; Wannamaker, 2005), anisotropic properties need to be considered to accurately interpret MT data.
In recent years, a number of studies have been dedicated to MT modeling and inversion for 1-, 2- or 3-dimensional (3-D) anisotropic media (Bai et al., 2022; Cao et al., 2021; Rong et al., 2022). 1-D MT problems can be analytically solved from Maxwell’s equation through matrix propagation methods (O’Brien and Morrison, 1967; Reddy and Rankin, 1971). The EM field obtained from 1-D anisotropic modeling is employed to deal with the boundary conditions of MT modeling in 2- or 3-D anisotropic media (Li and Pek, 2008; Xiao et al., 2018).
In the case of the MT method, which in need of considering frequencies as low as 0.01~0.001 Hz, the depth of the model used for forward modeling should be of sufficient depth such that the components of EM fields become zero at the bottom boundary, i.e., approximately five to six times of skin depth. For instance, in both Dublin test model 1 (DTM1) utilized by Usui (2015) and Iheya North Knoll used by Usui et al. (2018), the depth of the computational domain was set to be 3000 km. However, the matrix propagation technique can be unstable, suffering from NaN (not a number) values, when the EM fields are computed at depths or at layers extending to several thousand kilometers.
In this study, we propose strategies to stably compute analytic solutions using the matrix propagation method for anisotropic layered models at any depth, including great depths and thick layers. The first strategy addresses instability at great depths by converting upgoing and downgoing EM fields into numerically stable exponential forms, ensuring solutions converge to zero as depth increases. The second strategy handles very thick layers by checking if the determinant of the matrix for each layer is near zero and replacing such unstable layers with an infinite half-space. By applying our strategies to 1-D anisotropic layered model, we show that our algorithm yields stable results even at great depths and thick layers. In addition, we apply the proposed algorithm to both 3-D anisotropic and isotropic media to verify the accuracy and effectiveness of the proposed strategies.
Theory and Methods
After deriving governing equations from Maxwell’s equations for an anisotropic 1-D layered model, we explain the process of computing the analytic solutions for anisotropic layers using the matrix propagation method.
Maxwell’s Equations in 1-D Anisotropic Media
For MT modeling in 1-D anisotropic media, governing equations expressed only in terms of the electric field can be derived from Maxwell’s Equations. Under the assumption that the Earth’s conductivity varies only with depth and is uniform in horizontal direction, i.e., , the corresponding equations can be defined as follows (Pek and Santos, 2002):
where
The electric fields for x and y directions ( and ) can be calculated using the equations (1), (2), (3), (4), (5), (6) and the electric field for the z direction is defined as (Pek and Santos, 2002). The parameters, 𝜔, and 𝜀, represent the angular frequency, magnetic permeability in free space and electric permittivity, respectively ( for EM surveys including MT). The anisotropic media is presented by the conductivity tensor as follows:
and the conductivity tensor is symmetric. Thus, and in equations (4) and (5) are equal. From equations (1), (2), (3), (4), (5), (6), it can be inferred that electric fields of the plane-wave are affected only by the six independent variables of the conductivity tensor, which can be simplified to three independent variables of A (, and ) (Pek and Santos, 2002).
Analytic Solutions using the Matrix Propagation Method
EM fields in a layered earth can be computed using a matrix propagation method which utilizes a propagation matrix to relate the electric and magnetic field at the top and bottom of each layer. This matrix is combined iteratively throughout the entire layered model to form a total propagation matrix. The matrix propagation method is required for computing EM field at any depth in any layer of an 1-D medium.
Analytic Solution for 1-D Anisotropic Media
Since the general solutions of equations (1) and (2) can be expressed in the form of , it is easily noted that there exist two solutions corresponding to the two different wavenumbers ():
In a general anisotropic layered medium, where , the x- and y-components of the electric fields ( and ), are not independent. The relationship between and can be expressed as follows:
where the coefficient can be computed by substituting equations (9) and (10) into equations (1) and (2) as follows:
The general solution of satisfying equations (1) and (2) can be expressed as follows:
where , and are constants for two upgoing wave components, and and are constants for two downgoing wave components. Using the coupling effect of and , the system of equations for , , and can be defined as follows:
where . As the elements of can be obtained from the anisotropic layered model, d of each layer remains the only variable to be solved to compute the components of the EM fields. Because of the continuity condition for the horizontal EM fields, those at boundary computed at the lth and (l + 1)th layers must be of the same value as follows:
Thus, the relationship between dl for the lth layer and for the (l + 1)th layer can be written by
From equations (15) and (16), the EM fields at the top boundary of the air layer (0th layer) to which the boundary condition applies can be expressed by dN of the bottom layer:
Since only the downgoing wave components exist in the last layer (infinite half-layer), and should be zero. As the boundary condition at the top boundary of the air layer applies that is usually = (1,0,0) or = (0,1,0), and dN is composed of only and , the 4 × 4 matrix in equation (17) can be reduced to the 2 × 2 matrix as follows:
As , and the elements of are known, dN can be computed using equation (18).
By using equation (16) and dN, it is now possible to compute d at all layers of the anisotropic model. With defined from the layered model and the calculated vector d for each layer, the components of EM waves can now be computed from equation (14).
The EM field for isotropic medium can be represented in a similar manner to equation (13) as follows:
where .
Stabilization strategies for numerical computation of 1-D solutions
Stabilization strategy I
Stability strategy I (SS-I) is based on the open-source code ‘MARE2DEM’ (Key, 2016), which modify the exponential terms to numerically stable form to compute the electric and magnetic fields at any profound depths of layered anisotropic models. According to equations (13) and (19), the positive exponential terms of , approach infinity as z increases drastically. As the positive exponential terms approach infinity, numerical instabilities, i.e. NaN values, may occur when computing the inverse of according to equations (16) and (17). To avoid such numerical instabilities, SS-I modifies the exponential terms to for downgoing wave components and for upgoing wave components at the ith layer. By applying this strategy to equations (13) and (19), all the terms within the exponential functions are always negative and thus, become numerically stable exponential terms which converges to zero as z increases excessively. We can obtain two new matrices for anisotropic and isotropic media as follows:
Equations (20) and (21) can be expressed in a simplified manner as follows:
where comprises the components of EM field, is a matrix composed of the modified exponential terms and d´ is a vector of the corresponding upgoing and downgoing wave components. By using the continuity solution, solving the components of the EM fields of equation (22) are identical to obtaining the analytic solution for 1-D anisotropic media as shown in equations (15), (16), (17). Fig. 1(a) shows how the term is computed for downgoing wave components; and Fig. 1(b) represents how for upgoing wave components is computed. As shown in Fig. 1(a) and 1(b), the terms inside the exponential functions in are always defined by negative values, which improve the stability of the computational process. By defining the exponents by negative values, the terms converge to zero [ as ]. This modification allows us to stably compute the EM fields and prevents numerical overflow at large depths.
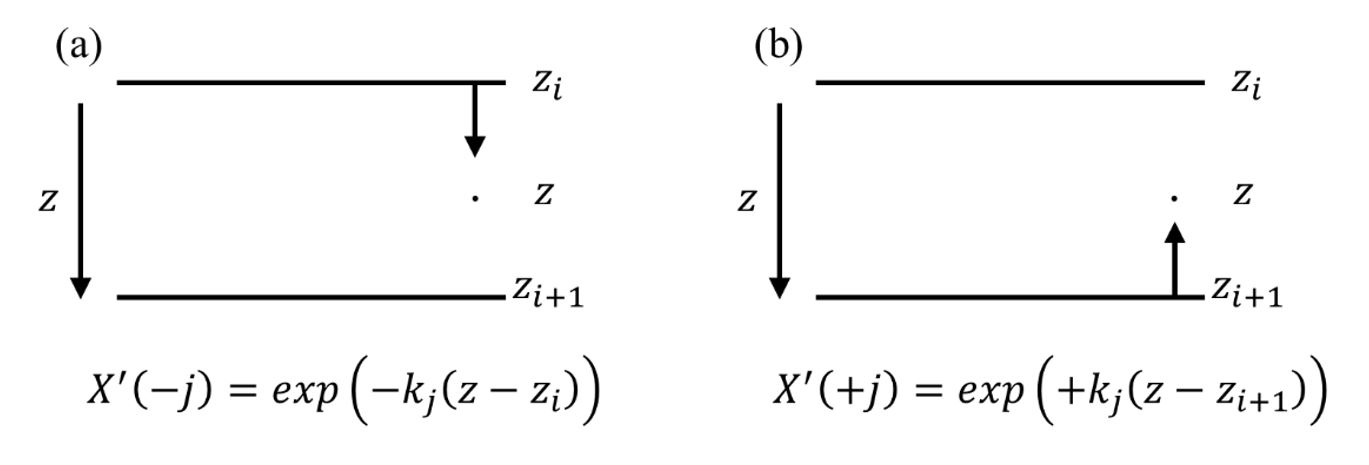
Fig. 1.
Computation of general solutions of in equations (20) and (21) at an arbitrary depth () in the ith layer with the upper () and lower () boundaries for (a) downgoing wave components and (b) upgoing wave components .
Stabilization Strategy II
As shown in equations (16) and (17), computation of the inverse matrix where i varies from 0 to is necessary for solving the components of the EM fields. The components of are defined as and . When the thickness of the ith layer is too thick, the term of converges to zero. The problem associated with this phenomenon is that, according to equations (20) and (21), the elements of the second and fourth columns of also become zero. Thus, the inverse matrix of may not be computed, for which the computation of the electric and magnetic fields for a layered model with a thick layer can be numerically unstable.
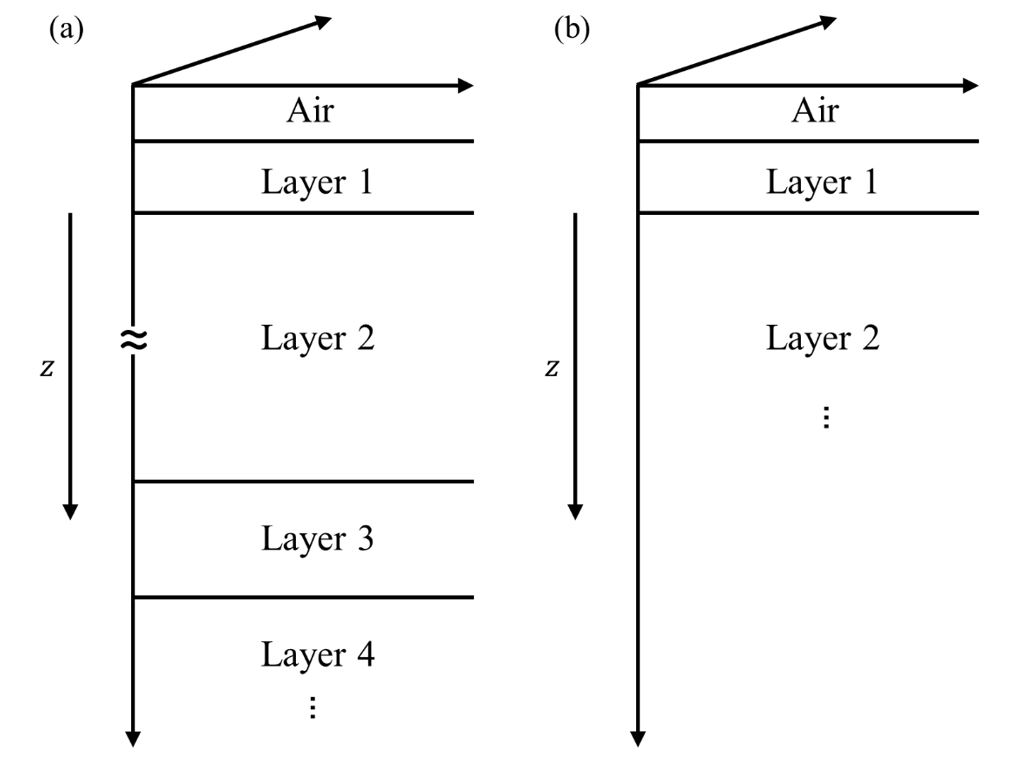
To overcome this limitation, SS-II first computes the determinant of for each layer of a given model before computing and d´. When the determinant of a certain thick layer is less than a given tolerance, the underlying layers do not have a significant effect on the EM fields, which means that the underlying layers can be neglected. Therefore, we can replace the thick layer with an infinite half-space (Fig. 2), which allows us to avoid the unstable calculation of the inverse matrix of for the thick layer. Through this procedure, we can stably compute the EM fields for a given model with a thick layer. In particular, the stability condition of this problem changes depending on the frequency of the EM fields and the components of the conductivity tensor of each layer. However, because the elements of take all the values for the frequency and the conductivity tensor into account, SS-II based on the determinant of the matrix is highly applicable and versatile.
Fig. 2(a) shows a 4-layered model that we apply SS-II to. It is assumed that the second layer (Layer 2) is a thick layer and the last layer (Layer 4) is the infinite half-space. To compute the EM fields of the model shown in Fig. 2(a), we first compute the determinant of for each layer of the model excluding the bottom layer according to SS-II. Because the determinant for the second layer of Fig. 2(a), which is too thick, is smaller than the given tolerance, we replace it with an infinite half-layer as shown in Fig. 2(b).
Numerical Experiments
To demonstrate the accuracy and effectiveness of our algorithm, we apply the strategies to another 4-layered anisotropic model.
Verification of the two proposed strategies
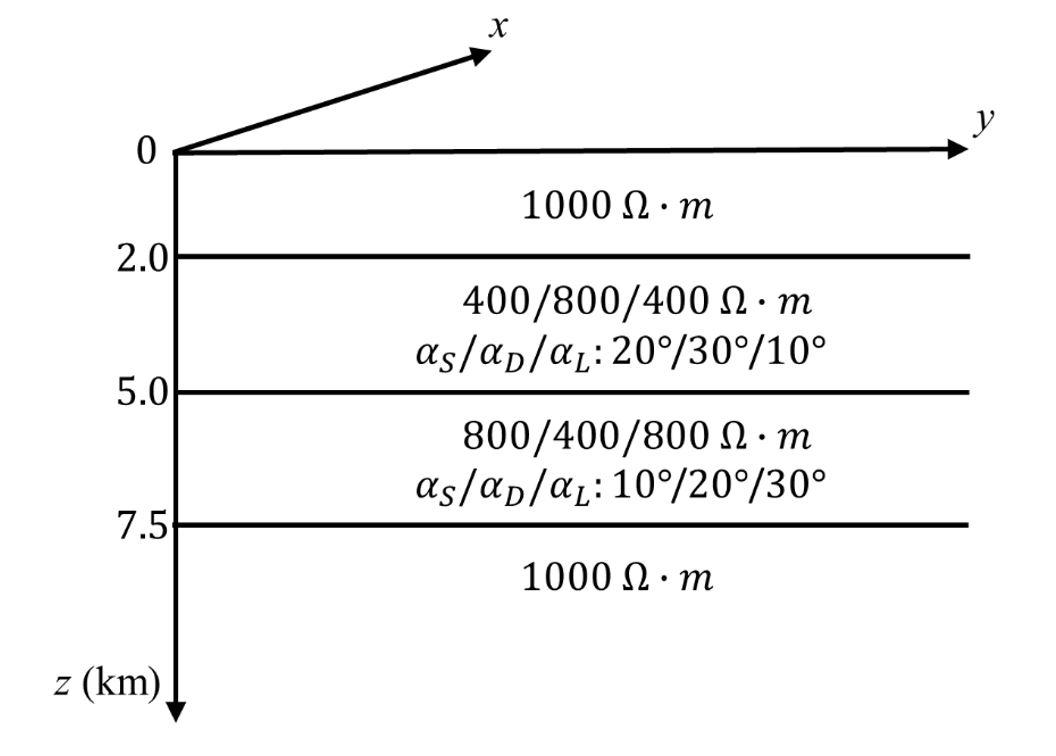
In the 4-layered anisotropic model shown in Fig. 3, the top layer and bottom half-space are assumed to be isotropic with resistivity of 1000 Ω·m; and the second and third layers are anisotropic with the principal resistivities of 400/800/400 Ω·m and 800/400/800 Ω·m with the Euler’s angles of 20°/30°/10° and 10°/20°/30°, respectively. The resistivity of the air layer is assigned to be 109 Ω·m and we use a total of 21 frequencies sampled at a uniform interval on the logarithmic scale ranging from 0.01 to 100 Hz in the computational process.
In Fig. 4, we compare the MT responses computed at the surface using our algorithm with those obtained from the code provided by Pek and Santos (2002). Fig. 4(a) and 4(b) show that the xy- and yx-components of the apparent resistivity and phase computed by our algorithm are highly accurate and similar to those obtained by the 1-D code of Pek and Santos (2002). This is further supported by the relative errors and phase differences displayed in Fig. 4(c) and 4(d). According to Fig. 4(c), the relative errors in apparent resistivity between our algorithm and Pek and Santos (2002) algorithms are almost negligible, approximately 0.004% for the xy-component and 0.003% for the yx-component. In Fig. 4(d), the phase differences are approximately 0.005° for both the xy- and yx-components. These results support for the accuracy of our algorithm.
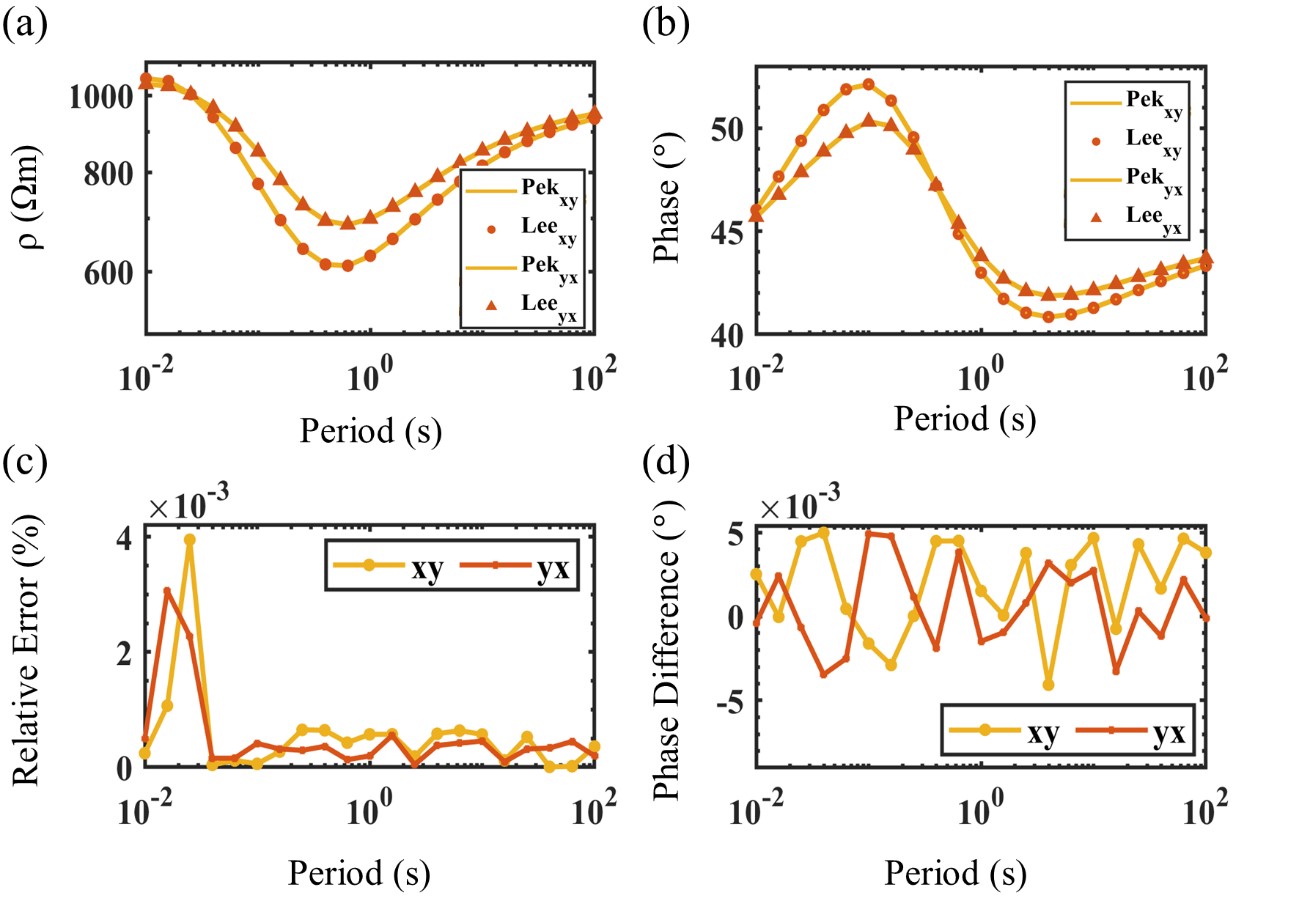
Fig. 4.
The xy- (the orange circles) and yx-components (the orange triangles) for (a) the apparent resistivity and (b) phase computed by our algorithm (denoted by “Lee”) with those obtained by Pek and Santos (2002) algorithm (the solid yellow line; denoted by “Pek”). (c) and (d) show the relative errors of the apparent resistivity and the phase differences between our and Pek and Santos’ algorithms for the xy- (the solid yellow line with points) and yx-components (the solid orange line with points), respectively.
Numerical Experiments
We compare the real x-component of the electric fields calculated using our algorithms with and without SS-I and SS-II to examine their effects. For SS-I, we compare the electric fields at receivers with different depths to investigate if SS-I stabilizes the numerical computation of the electric field, specifically at deep depths. For SS-II, we compare the electric fields at the surface varying the thickness of the first layer in the layered model, from which we can examine if SS-II resolves numerical instability at large thickness of the first layer. All the calculations are conducted with our algorithm based on 4-bytes to efficiently visualize the computational results.
Stabilization Strategy I
As mentioned in the subsection ‘Stabilizing Strategy I’, SS-I was designed to stably calculate the EM fields at any great depths of layered models. To confirm the effectiveness of SS-I, we compare the real part of x-component of the electric fields obtained by the conventional matrix (equations 13 and 19) and modified matrix (equations 20 and 21) according to the depth of receivers (0 ~ 10,000 km). For the numerical experiments, we use the layered model shown in Fig. 4 and a single frequency of 10 Hz.
Fig. 5 shows the responses of computed using the conventional method and SS-I when the plane wave sources, = (1,0,0) (Fig. 5(a)) and = (0,1,0) (Fig. 5(b)), are applied. In Fig. 5(a) and 5(b), the electric fields obtained by the conventional method and SS-I are nearly identical up to a certain depth (about 447.6 km). However, the conventional method produces NaN values for for both and below a depth of 447.6 km, which is denoted by the orange curly bracket. In contrast, the algorithm with SS-I stably compute the electric fields, so that they converge to zero even below a depth of 447.6 km.
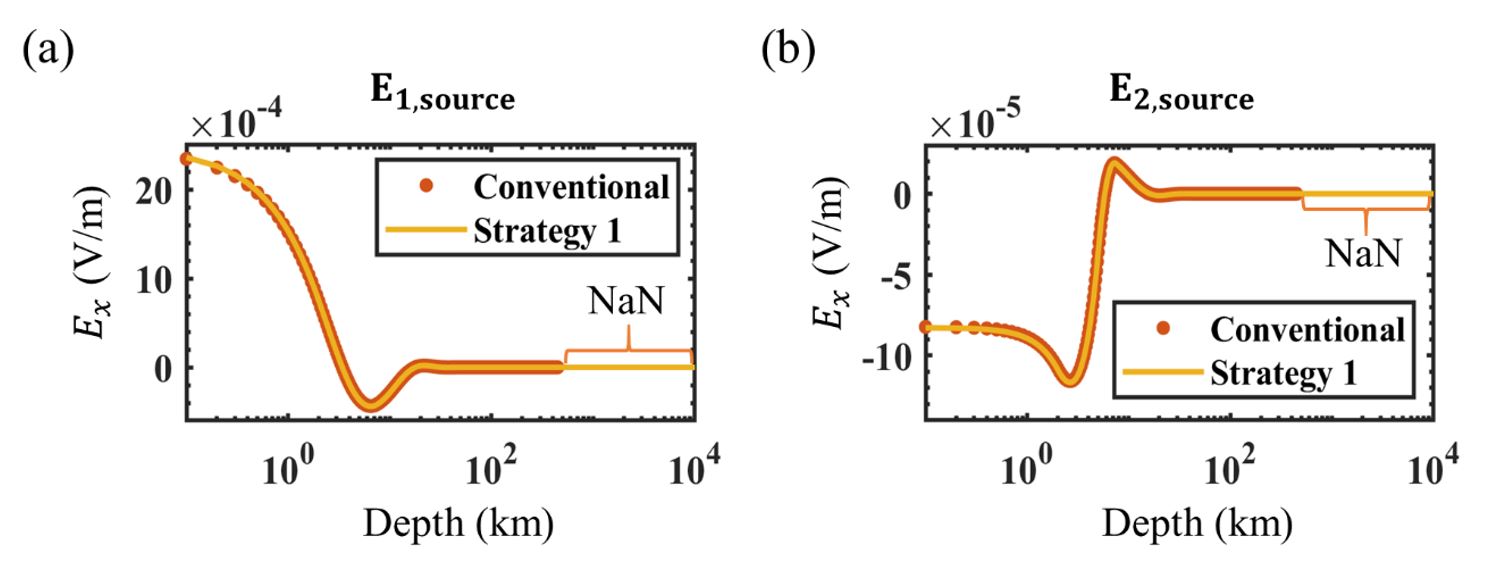
Fig. 5.
The real x-component of the electric field for (a) = (1,0,0) and (b) = (0,1,0) with respect to the depth of receivers (0 ~ 10,000 km). The results computed by the conventional method and SS-I are displayed with the orange markers and yellow solid lines, respectively. The part displayed by the orange curly brackets indicates the depths with NaN values for the conventional method.
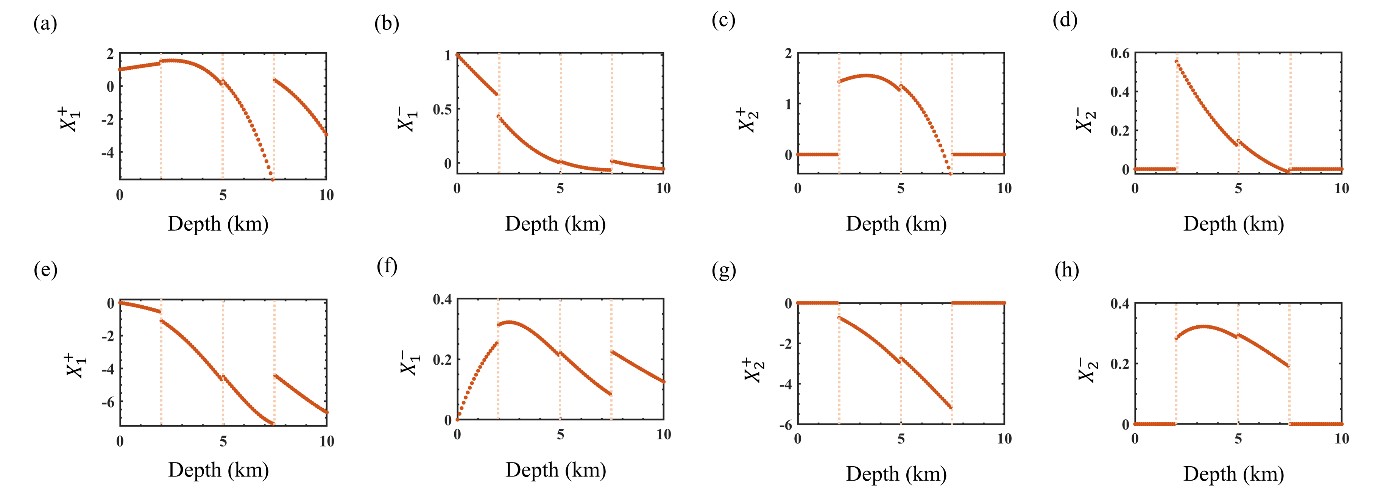
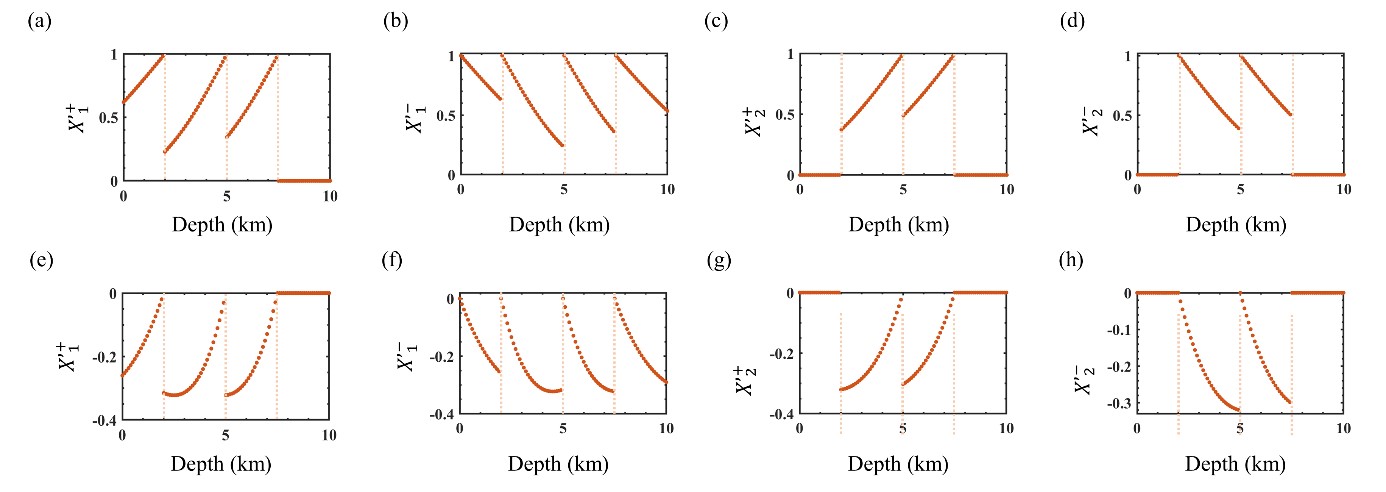
Among the terms and which are the general solutions required to compute with respect to the depth of the receiver for the conventional method and SS-I, Figs. 6 and 7 shows the real and imaginary components of the term up to a depth of 10 km. It is observed that the terms and show continuous results within each layer, but discontinuous results at the boundaries of layers. Because layer 1 (0~2 km) and layer 4 (7.5 km ~) are isotropic, the terms and are zero (see Figs. 6(c) and 7(c)). The terms and computed with both the conventional method and SS-I do not suffer from numerical instabilities at shallow depths. As increases , the terms , and converge to zero as . In contrast, because , , numerical instabilities may occur.
Tables 1 and 2 show the results of d and d´ at each layer whose components are the coefficients required to compute . In Tables 1 and 2, there are no numerical instabilities of d and d´ at each layer. Because upgoing wave components at the last layer do not exist, the values for components , , and are all zero. Even if has large values at depths shallower than 447.6 km, is not affected because is zero, and thus . However, below a depth of 447.6 km, becomes infinity, resulting in numerical instability in the computation of . Table 2 shows that SS-I does not suffer from numerical instability in computing d´.
Table 1.
Vector d calculated with the conventional method
Table 2.
Vector d´ calculated with SS-I
Additionally, Tables 1 and 2 show that the components of d and d´ are not affected by the depth of the receiver in a given 1-D model. In contrast, the components of and are affected by the depth of the receiver, as depicted in Figs. 6 and 7. From these numerical experiments, we can conclude that the components of degrade the stability in the computation of using the conventional method at large depths, whereas the components of are computed in a stabilized manner through SS-I, allowing stable computation of the EM field at large depths, as shown in Fig. 5.
Stabilization Strategy II
As mentioned in subsection ‘Stabilization Strategy II’, the presence of a thick layer in a layered model can lead to unstable or inaccurate results in the computation of the electric and magnetic fields. To verify the effectiveness of the proposed algorithm with SS-II, a numerical experiment was conducted. The thickness of the first layer of the model shown in Fig. 3 varies from 2 to 1002 km in a uniform increment of 0.1 km. A receiver is located at the surface and a single frequency of 10 Hz is used. The tolerance was empirically determined, and from several numerical experiments, we recommend the tolerances of 10-27 and 10-100 for the algorithms with 4-bytes and 8-bytes, respectively.
Fig. 8 shows the real x-component of the electric field computed without and with SS-II for both = (1,0,0) (Fig. 8(a)) and = (0,1,0) (Fig. 8(b)), when the thickness of the first layer in Fig. 3 increases from 2 to 1002 km. In Fig. 8(a) for , computed with SS-II converges an approximate value of 2.5 × 10⁻³ V/m whereas computed without SS-II produces NaN value beginning at a thickness of 187.5 km which is denoted with the orange curly brackets. In Fig. 8(b), when the thickness exceeds 187.5 km, computed with SS-II for converges to zero, whereas computed with the conventional method yields NaN values. As mentioned in the subsection of ‘Stabilizing Strategy II’, the corresponding strategy determines whether the determinant of the first layer (det ) is smaller than the given tolerance. If the thickness of the first layer exceeds 166.4 km for , which means that the determinant of is less than the tolerance, the first layer is replaced with a new infinite half-space, which enables numerically stable computation of the EM field.
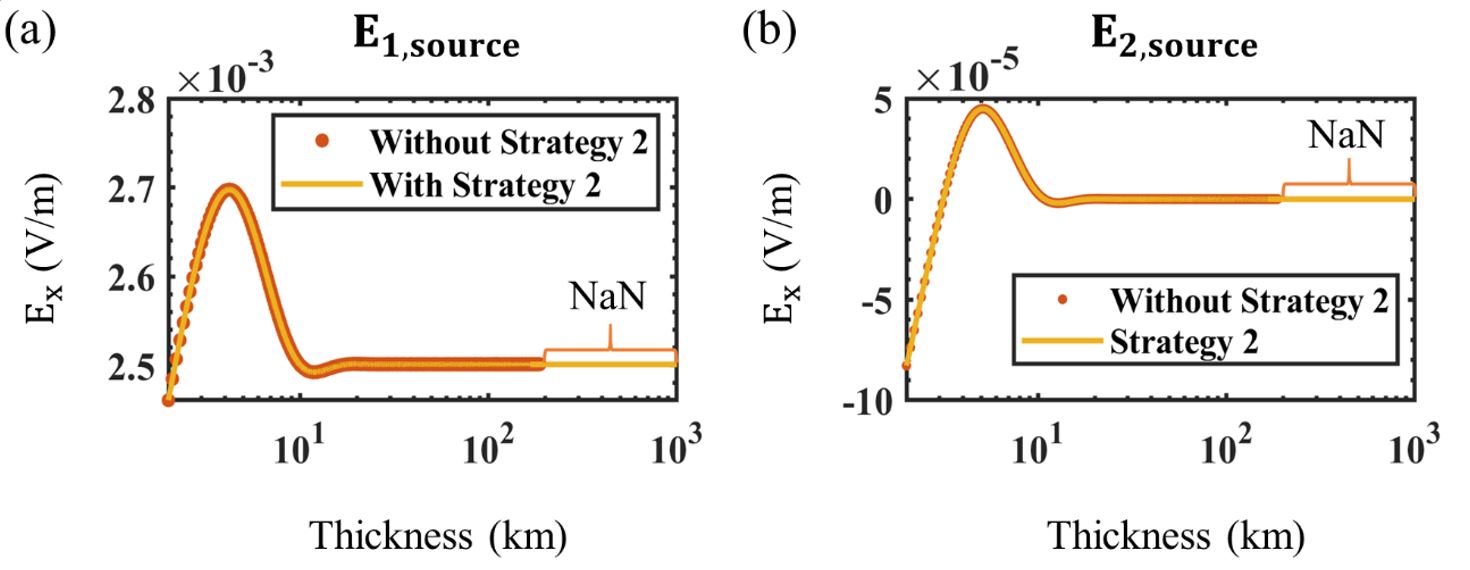
Fig. 8.
The real x-component of the electric field computed for (a) = (1,0,0) and (b) = (0,1,0) according to the thickness of the first layer in Figure 4 (from 2 to 1002 km) obtained by the algorithms without (the orange points) and with (the solid yellow lines) SS-II. The thicknesses with NaN values in (a) and (b) are denoted with the orange curly brackets.
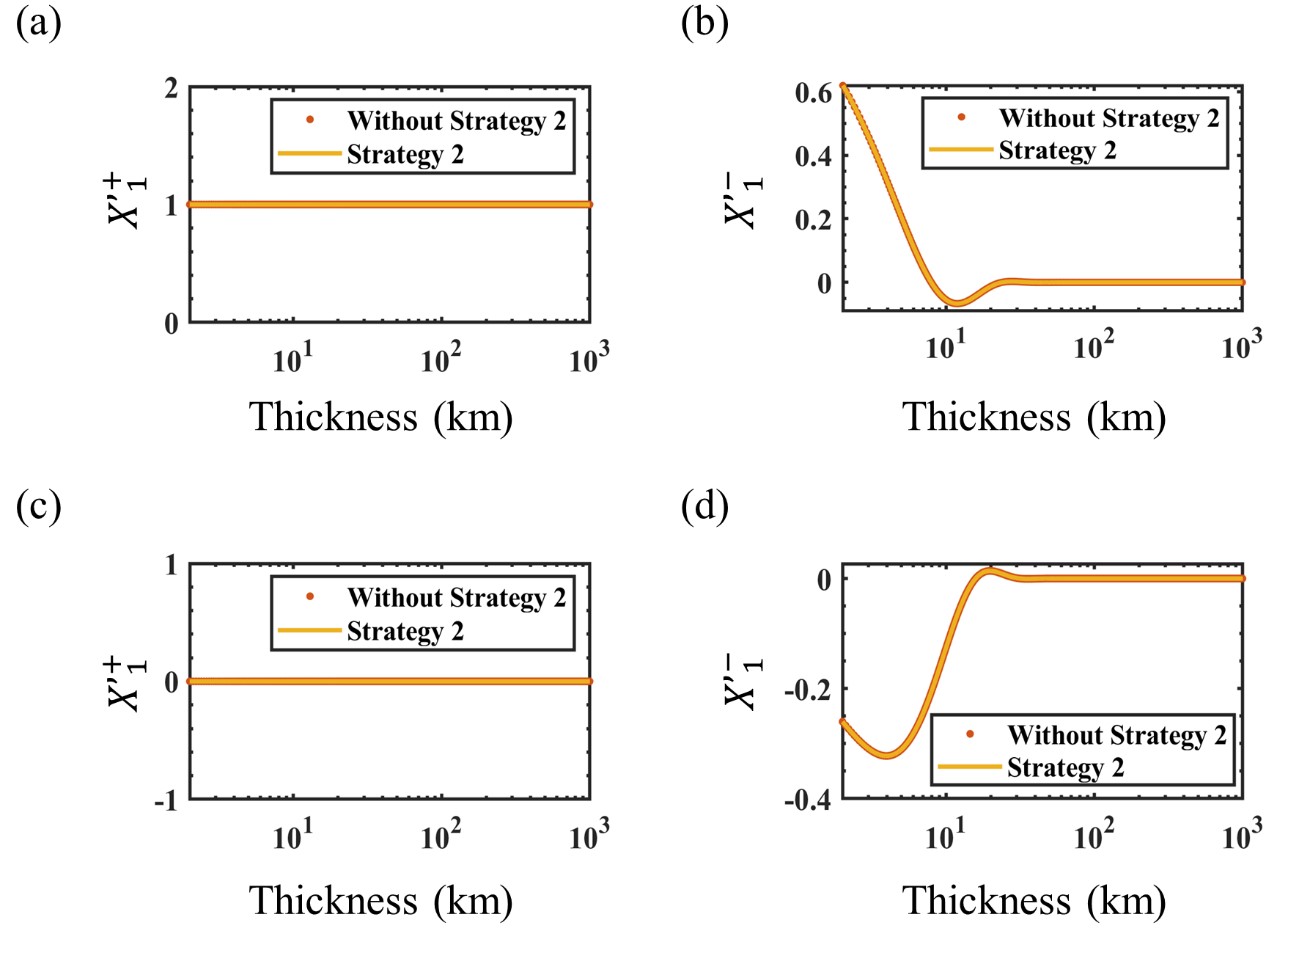
We now discuss the factors that may cause instability for a thick layer in the computation process of and how SS-II stabilizes the computational process. Because the first layer shown in Fig. 3 is isotropic, at the surface can be defined as according to equation (21). can be defined as at the surface and as increases, converges to zero, and the term at has a constant value of 1 as .
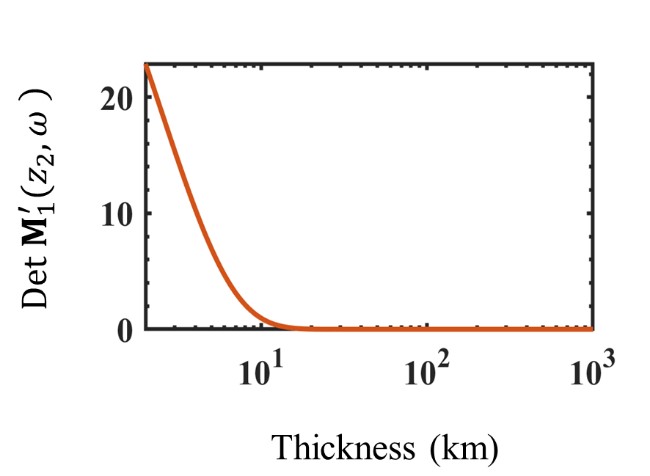
The components of d´ for each layer can be computed using the continuity condition, which require calculating the inverse of . takes the form as shown in equation (21) because the first layer is isotropic. Fig. 9 shows the real and imaginary components of and of . Fig. 10 shows the determinant of . Because the first layer is isotropic (i.e., ), the components as shown in Fig. 9(a) and 9(c). However, the components converges to zero, when continues to increase, as shown in Fig. 9(b) and 9(d). Similarly, in equation (21) converges to zero as increases. Consequently, as the thickness of the first layer increases, the elements of the second and fourth columns of become zero according to equation (21) and thus the determinant converges to zero as shown in Fig. 10. Thus, the computation of the inverse of becomes numerically unstable, which also result in unstable computation of d´ of each layer.
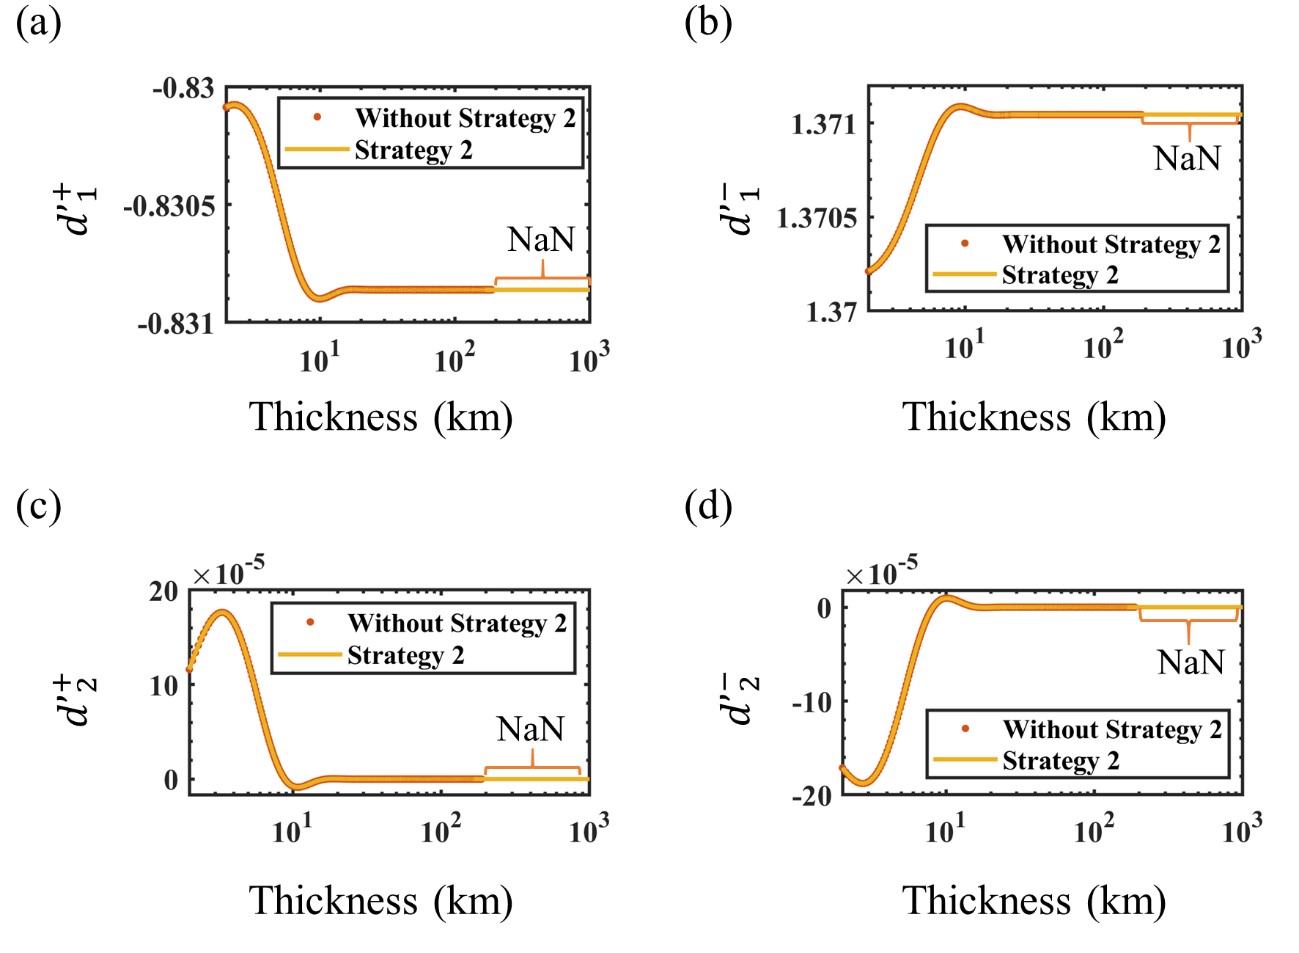
Fig. 11 shows the real components of d´ computed without and with SS-II at the surface, when the thickness of the first layer varies from 2 to 1002 km. As mentioned before, the components , , and produce NaN values at thicknesses larger than 187.4 km when computed without SS-II (refer to the curly orange brackets in Fig. 11). As in the first layer, it results in unstable computation of starting at a thickness of 187.5 km as shown in Fig. 8(a) and 8(b). With the implementation of SS-II, when the thickness of the first layer exceeds 166.4 km, the corresponding layer can now be regarded as an infinite half-space. As a result, based on equation (24), the computation of d´ does not require the inverse matrix of , preventing numerical instabilities as the components , , and converge to ‒0.831, 1.371, 0 and 0, respectively. Thus, SS-II allows numerically stable computation of the EM field at presence of a thick layer.
3-D Model II (3D homogeneous model for initial model of inversion)
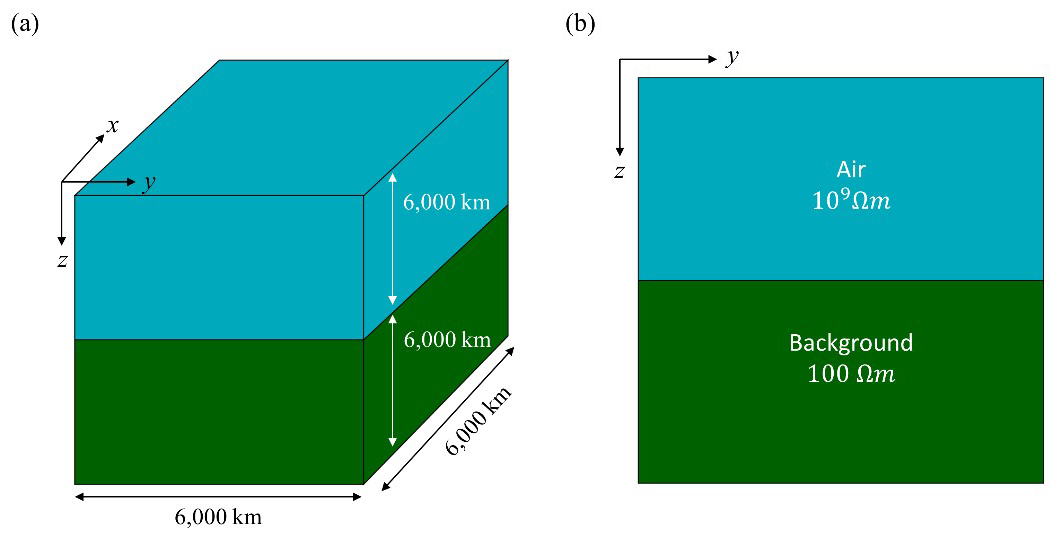
In 3-D MT inversion, where both low and high frequencies must be considered, accurate computation of EM fields at low frequencies need increasing size of the mesh with depth, which may cause numerical errors in forward modeling response at high frequencies. To prevent arising of such numerical instabilities, our suggested strategies are of great importance. An extremely large 3-D homogeneous isotropic model with a background resistivity of 100 Ω·m and a computational domain of 6,000 km × 6,000 km × 6,000 km as shown in Fig. 12, was used to illustrate the effectiveness and accuracy of SS-I and SS-II
Fig. 13(a) and 13(b) show the computed xy-components of forward modeling responses, i.e., apparent resistivities and phase, and Fig. 13(c) and 13(d) show the relative error in computed forward modeling responses between the open-source code (Bai et al., 2022) and the proposed algorithm for a total of 17 frequencies ranging from 0.0001 Hz to 1 Hz. As shown in Fig. 13, the forward modeling responses computed with the proposed algorithm and the open-source code show stable results at low frequencies. However, as shown in Fig. 13, the forward modeling responses computed using the open-source code start to diverge and show numerical instabilities at higher frequencies, which is denoted by the orange curly brackets. In contrast, the forward modeling responses computed with the proposed algorithm, denoted by the solid yellow line, show stable results even at higher frequencies. From Fig. 13(a) and 13(b), it is evident that the forward modeling responses computed with the open-source code begin to show numerical instabilities starting from a frequency of 0.1 Hz. In contrast, the proposed algorithm shows stable computation of the forward modeling responses even beyond a frequency of 0.1 Hz. The two forward modeling responses match well, with a maximum apparent resistivity error of 0.71% and a maximum phase error of 0.13° for both xy- and yx-components, respectively. From numerical experiments, it can be seen that SS-I and SS-II allow stable computation and prevent numerical instabilities even in an extremely large 3-D model, further verifying the effectiveness of the proposed algorithm.
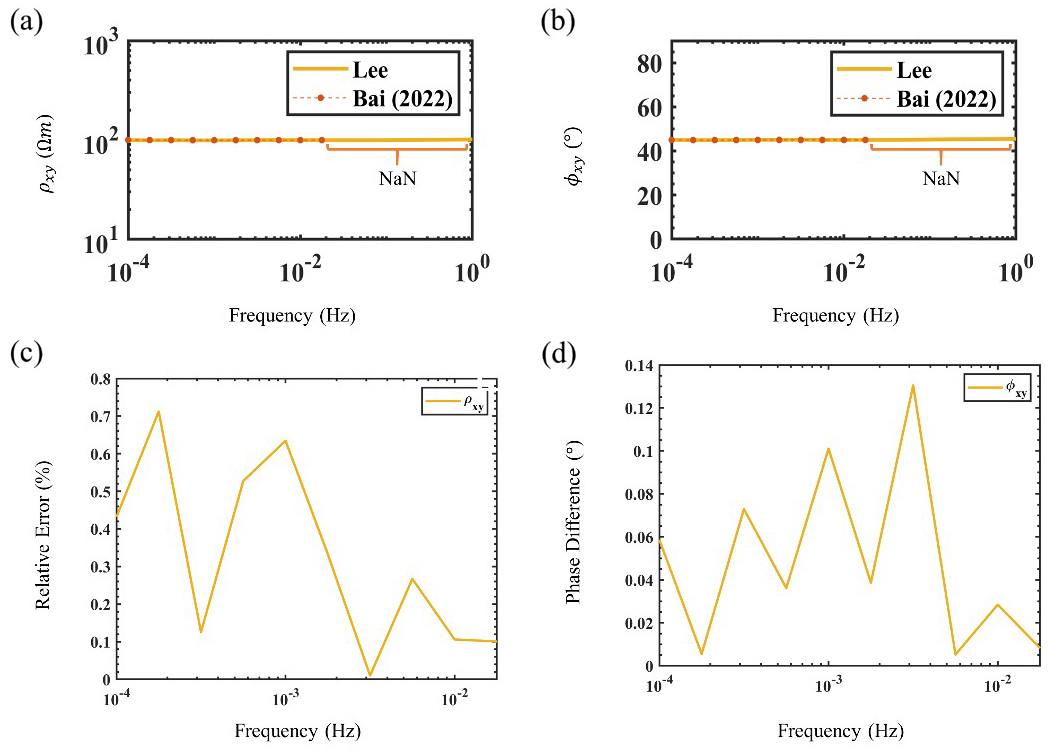
Fig. 13.
Components of (a) , (b) computed using the proposed algorithm denoted with the yellow solid line and open-source code (Bai et al., 2022) denoted with the orange markers along the dotted line. (c) and (d) represent the relative error and difference of xy-component of apparent resistivity and phase between the proposed algorithm and open-source code, respectively. The section where NaN values appear is denoted with the orange curly brackets.
Conclusions
For a stable computation of various MT responses and EM fields at an arbitrary depth of 1D layered models including both isotropic and anisotropic layers, we proposed the two strategies. The first strategy involves converting the general solutions of the second-order differential equations into computationally stable forms to prevent the components of EM field from diverging at large depths. The second strategy assesses whether each layer of the layered model is thick enough to cause instability. Through the numerical experiments on the synthetic model, we confirmed that our algorithm stably computes the EM waves even at considerable depths and yields stable and accurate results even in the presence of an extremely thick layer. The developed algorithm designed for 1-D anisotropic media can be adapted to satisfy the boundary conditions in multi-dimensional (2-D and 3-D) MT or EM modeling.


