Introduction
Methodology
Experimental system
Surrogate fluids and reservoir materials
Calibration for estimating fluid saturation
Steady-state relative permeability test
Test procedure and conditions
Results and Discussion
Saturation profiles
Directional dependence of the kr–S relationship
Relations with dimensionless numbers
Limitations of this study
Conclusion
Appendix
Criteria for the steady-state
Introduction
Among the various strategies to achieve net-zero emissions, Carbon Capture and Storage (CCS) is a key technology that captures CO2 from industrial and power generation sources and stores it underground. Consequently, extensive research and development efforts have been directed toward the challenges (Ashworth et al., 2015; Bachu, 2008; IPCC, 2005) and improvements (Buscheck et al., 2011; Kim et al., 2025). In addition, fundamental studies also have been conducted to understand complex behaviors of CO2 in porous medium such as hysteretic properties (Ershadnia et al., 2021; Juanes et al., 2006), permeability heterogeneities (Lengler et al., 2010; Oh et al., 2019), and fingering behaviors (Gooya et al., 2019; Yamabe et al., 2015).
The relative permeability curve is constitutive relationship for understanding and modeling the macroscopic immiscible two-phase flow in porous medium which should reflect the pore-scale flow characteristics (Bryant and Blunt, 1992; Xu et al., 2013). Immiscible two-phase flow is well-known to be governed by the interplay among capillary, viscous, and gravity forces (Méheust et al., 2002; Toussaint et al., 2012; Vincent-Dospital et al., 2022). Under the interactions between the capillary and viscous forces, three distinct flow patterns, stable displacements, capillary fingering and viscous fingering and their parametric region determined by the capillary number (Ca) and viscosity ratio (M) were reported by Lenormand et al. (1988) and thereafter, plenty of following studies suggested the parametric region with their own pore structures (Bakhshian et al., 2019; Hu et al., 2020; Zhang et al., 2011).
Two-phase displacement patterns under the effect of gravity were also analyzed from vertical experiments using favorable and unfavorable density contrasts (Cinar et al., 2009; Frette et al., 1992; Muharrik et al., 2018; Suekane et al., 2015). Because these fingering phenomena and chaotic flow patterns can induce unexpected flow behavior by causing early breakthrough of CO2 and limiting the storage capacity (Eide et al., 2019; Ratanpara et al., 2025). It is crucial to accurately capture the pore-scale two-phase flow characteristics by determining proper relative permeability curve which is macroscopic representation of pore-scale flow patterns. In these studies, however, the influence of gravity on the relative permeability curve has been mostly neglected, even though it is evident that gravity can modify the relative permeability curves by changing flow patterns in between upward and downward displacements (Prats and Lake, 2008).
To address the effect of gravity on the relative permeability curve, we designed 1 m-long column apparatus for the vertical relative permeability test. In this study, we present an experimental system developed to investigate gravitational effects in vertical two-phase flow and describe the flow behavior observed during the tests, the corresponding pressure and saturation measurements, and the resulting direction-dependent relative permeability curves.
Methodology
Experimental system
In this study, an experimental system was constructed using transparent acrylic cylinders to facilitate packing of the reservoir material and visualization of immiscible two-phase flow (Fig. 1). A cylindrical cell (hereafter, “cell”) with an inner diameter of 6 cm and a length of 25 cm was fabricated and designed to accommodate both saturation and pressure measurement devices.
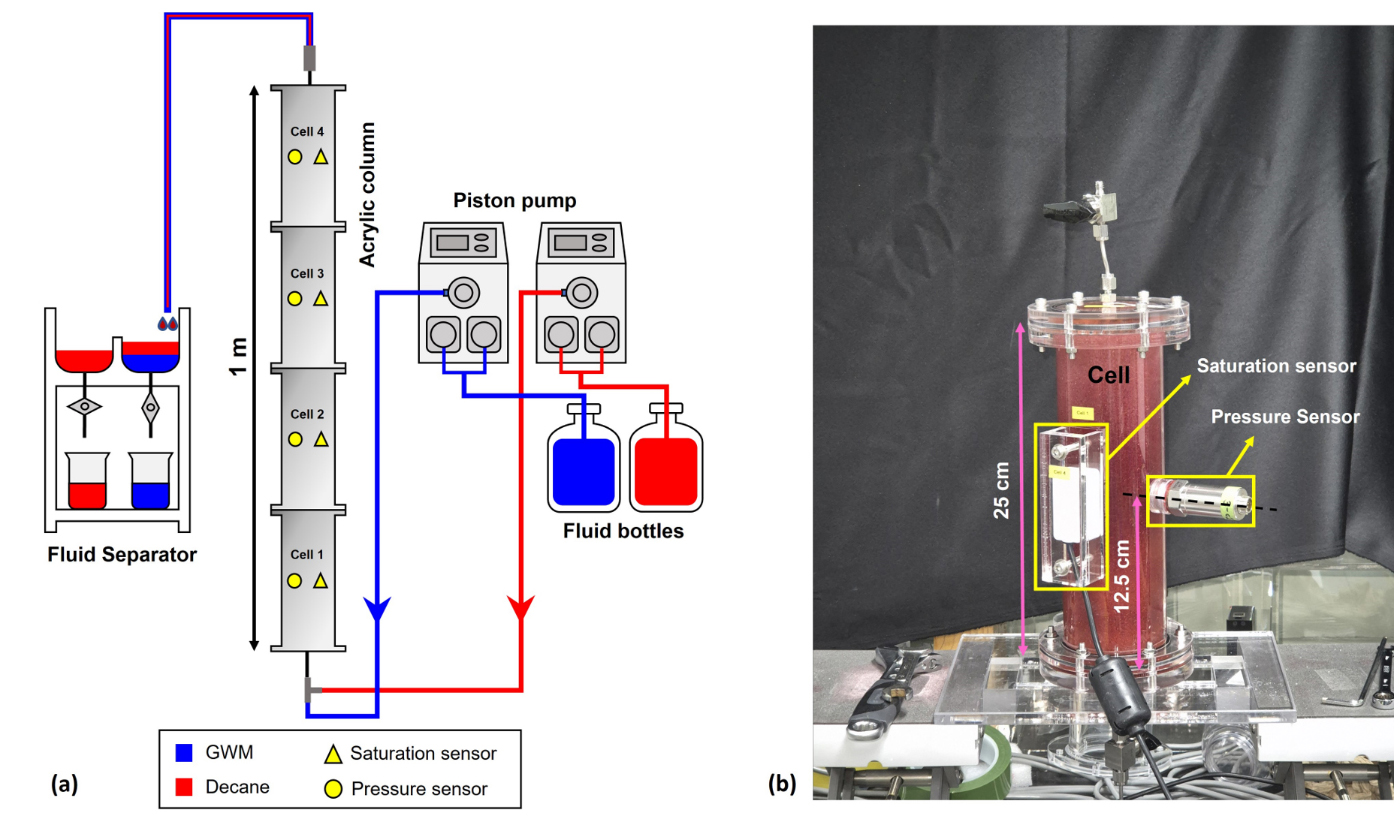
The pressure-measurement port was fabricated to allow a pressure transmitter (PHP series, Sensys, Republic of Korea) to be connected via a threaded coupling. A stainless-steel mesh was installed at the interface between the cell opening and the sensor to prevent loss of porous material into the pressure-sensing cavity and thereby avoid disturbance of the packed medium. A rubber O-ring was placed at the front end of the pressure sensor to ensure a tight, leak-free installation. The saturation-measurement port was designed to allow a soil-moisture sensor (TEROS 10, METER Group, USA) to be inserted into the packed reservoir material through two central openings on the cell wall. The sensor was fixed in place using a rubber O-ring and further secured by tightening an external holder that pressed the sensor against the cell wall to prevent leakage.
Four cells were connected in series to form a 1 m-long column, and thus four pressure sensors and four saturation sensors were installed along the flow direction. The junctions between adjacent cells were sealed with rubber O-rings and fastened using flange-type couplings to prevent leakage. This modular design allows the total column length to be adjusted according to the experimental conditions. At both ends of the column, inlet and outlet plates equipped with valves for tubing connections were attached to the cells. Between each end plate and the packed reservoir material, a stainless-steel mesh and a supporting porous plate were installed to prevent mobilization of the reservoir material toward the inlet or outlet. In addition, a small void space was provided immediately downstream of the inlet tubing so that the injected fluid could first fill this space and then enter the column as a relatively uniform front, thereby minimizing the impact of point-source injection.
Fluid injection was carried out using two high-precision piston pumps with controllable flow rates from 0 to 99.99 mL min-1 (UI-22, FLOM, Japan), operated separately for each fluid. After passing through the column, the effluents were separated using a density-based fluid separator and collected for reuse. All tubing, valves, and fittings from the pumps to the column outlet were made of chemically resistant stainless steel to minimize potential safety hazards associated with the surrogate fluids.
Surrogate fluids and reservoir materials
Injected CO2 in a deep geologic reservoir exists in a supercritical state, where saturated brine behaves as the wetting phase (WP) and scCO2 as the non-wetting phase (NWP). Although using scCO2 and brine directly in laboratory experiments would allow observation of in-reservoir flow behavior, it would substantially increase the complexity and cost of the experimental system. Therefore, we used a surrogate fluids pair instead of scCO2 and brine. This approach offers a practical alternative by reproducing key flow characteristics while minimizing cost and scale-related constraints.
In this study, a glycerol–water mixture (GWM), prepared by mixing glycerol and deionized water at 50:50 v%, was used in place of brine, and n-decane was used in place of scCO2. The density ratio, viscosity ratio, and interfacial tension of the surrogate fluid pair were 0.62, 0.12, and 36 dyne·cm-1, respectively, which fall within the range reported for scCO2–brine systems. Note that, although relative permeability is sensitive to wettability, the present surrogate-fluid system is designed to focus directional gravity effects under a simplified, homogeneous glass-bead packing. Accordingly, we do not interpret the results as a quantitative analogue of reservoir-rock contact-angle conditions. GWM was dyed blue using Acid Blue (TCI, Japan), and n-decane was dyed red using Sudan IV (TCI, Japan) to facilitate visualization of two-phase flow. Hereafter, GWM is referred to as the WP and n-decane as the NWP, and the fluid properties are summarized in Table 1. Note that the present study focuses immiscible-flow physics and gravity effects on the kᵣ–S relationship; scCO2 compressibility, wettability alteration, dissolution, and related processes are not considered here.
Table 1.
Fluid properties of fluid pairs under typical reservoir conditions and of the surrogate fluids used in this study
| Typical Reservoir | This Study | |||
| scCO2 | brine | n-decane | GWM 50:50 v% | |
| Density [g cm-3] | 0.27–0.73a | 0.95–1.3a | 0.73c | 1.2c |
| Viscosity [mPa s] | 0.023–0.061a | 0.20–1.6a | 0.91d | 7.9e |
| Density ratio [–] | 0.22–0.75 | 0.62 | ||
| Viscosity ratio [–] | 0.026–0.20 | 0.12 | ||
| Interfacial tension [dyne cm-1] | 20–60b | 36c | ||
dCalculated using correlation equation from Huber et al. (2005).
eCalculated using correlation equation from Cheng (2008).
The reservoir material packed into the acrylic cells was prepared in a homogeneous configuration to examine the influence of gravity under the simplest conditions. To obtain an isotropic packing, we used perfectly spherical glass beads (SiLiBeads®, Sigmund Lindner GmbH, Germany). The glass beads were wet-packed into the cells, and a mechanical vibrator was used during packing to achieve tight and uniform packing and to minimize the presence of trapped air.
Calibration for estimating fluid saturation
The key variables required to determine relative permeability curves are pressure and fluid saturation. Because pressure measurement technology is well established across many fields, pressure can generally be measured with high resolution and accuracy. However, it is difficult to obtain sensors that can directly and reliably measure the saturations of the surrogate fluids. In this study, saturation of the two surrogate fluids was measured using commercially available soil moisture sensors, and an empirical calibration was developed to convert raw sensor outputs into reliable saturation estimates (Sakaki et al., 2008).
An empirical relationship between sensor output and fluid saturations was obtained by recalibrating the response of the soil-moisture sensor, which estimates volumetric water content from bulk dielectric permittivity. The relative permittivities of water and air are approximately 80 and 1, respectively, whereas those of the selected surrogate fluids, GWM and n-decane, are approximately 63 (Akerlof, 1932) and 1.99 (Lide, 2005). For the calibration experiments, an acrylic cell was first packed with the porous medium and fully saturated with a single fluid. The fluid composition was then systematically varied by adjusting the volumetric ratios of the two fluids. At each ratio, the corresponding sensor output was recorded, and regressed to derive an empirical relationship between sensor reading and fluid saturation. Because the raw sensor response at full saturation depends on the porosity of the porous medium, separate calibration curves were obtained for each reservoir material in the relative permeability test. In all cases, the calibration data were well represented by a quadratic function.
Steady-state relative permeability test
To identify the directional dependence of the kᵣ–S relationship, we performed steady-state relative permeability tests using the surrogate fluid pair. Although this approach is time-consuming, it yields stable and reliable measurements. In each test, the two fluids were co-injected at a constant total flow rate with a prescribed flow-rate ratio, and measurements were recorded after pressure and saturation signals stabilized (see Appendix for the steady-state criterion). Once steady state is achieved, the recorded pressure and saturation values can be used to derive the kᵣ–S relationships based on the extended Darcy’s law:
where kr,i [–] is the relative permeability of fluid i, Qi [L3 T-1] is the injection rate of fluid i, µi [M L-1 T-1] is the dynamic viscosity of fluid i, Δl [L] is the distance between the two measurement points, A [L2] is the cross-sectional area perpendicular to the injection direction, ki [L2] is the intrinsic permeability, and ΔP [M L-1 T-2] is the pressure drop between the two measurement points.
Unlike horizontal steady-state relative permeability tests, vertical flow tests are affected by hydrostatic pressure differences between the two pressure measurement points, which depend on the saturation distribution of the fluids. Therefore, the measured pressure difference must be corrected using the following equations:
where ΔPinitial [M L-1 T-2] is the hydrostatic pressure difference, ρa [M L-3] is the saturation-weighted average density, Si [–] is the saturation of fluid i, Δh [L] is the elevation difference between the two points, and g [L T-2] is the gravitational acceleration. For this correction, the saturations measured at the corresponding cell were used as representative values for the interval between the pressure taps, and thus the hydrostatic correction should be interpreted as an approximation based on locally measured saturations.
Test procedure and conditions
The tests began with the column initially saturated with the WP, which is miscible with the water used in the wet-packing process. The drainage process was initiated by gradually increasing the NWP ratio in steps of +0.1×Qtot ml min-1 up to 100% NWP injection (injecting NWP only) to achieve maximum NWP saturation, where Qtot is the total flow rate. Subsequently, the imbibition process was initiated by gradually reducing the NWP ratio in steps of –0.1×Qtot ml min-1 down to 100% WP injection (injecting WP only), to finally determine the residual NWP saturation. Hereafter, the term “stage” refers to each step with a distinct ratio of the two fluids.
For the tests, upward- and downward-flow directions were selected because the influence of gravity is expected to have the strongest effect on the kr–S relationships under these conditions. Additionally, to investigate the influence of gravity under relative importance of capillary and viscous forces, we tested three porous media which have different grain diameters (d) with distinct intrinsic permeabilities (ki) and three total flow rates (Qtot). These conditions can be characterized using the bond number (Bo) and the capillary number. Here, quantifies the relative importance of buoyancy to capillary forces, where Δρ is the density difference between the two fluids, g is gravitational acceleration, ki is intrinsic permeability, and σ is interfacial tension. In addition, quantifies the relative importance of viscous to capillary forces, where µ is the dynamic viscosity of the NWP and q is the darcy flux. These provide a consistent framework to compare the force balance among gravity, viscous, and capillary effects across the test conditions. Detailed information on the test conditions and the corresponding dimensionless numbers is given in Table 2. Case 1–9 and case 10–18 were conducted under different flow direction, upward and downward, respectively.
Table 2.
Test conditions and the corresponding dimensionless numbers
| Case no. | Direction | Qtot [ml min-1] | Ca | d [mm] | kia[cm2] | Bo |
| 1 | Upward | 30 | 4.47E-06 | 0.2–0.3 | 3.96E-07 | 7.94E-06 |
| 2 | 30 | 4.47E-06 | 0.4–0.6 | 2.36E-06 | 2.82E-05 | |
| 3 | 30 | 4.47E-06 | 0.75–1.00 | 6.67E-06 | 8.13E-05 | |
| 4 | 40 | 6.03E-06 | 0.2–0.3 | 3.96E-07 | 7.94E-06 | |
| 5 | 40 | 6.03E-06 | 0.4–0.6 | 2.36E-06 | 2.82E-05 | |
| 6 | 40 | 6.03E-06 | 0.75–1.00 | 6.67E-06 | 8.13E-05 | |
| 7 | 50 | 7.41E-06 | 0.2–0.3 | 3.96E-07 | 7.94E-06 | |
| 8 | 50 | 7.41E-06 | 0.4–0.6 | 2.36E-06 | 2.82E-05 | |
| 9 | 50 | 7.41E-06 | 0.75–1.00 | 6.67E-06 | 8.13E-05 | |
| 10 | Downward | 30 | 4.47E-06 | 0.2–0.3 | 3.96E-07 | 7.94E-06 |
| 11 | 30 | 4.47E-06 | 0.4–0.6 | 2.36E-06 | 2.82E-05 | |
| 12 | 30 | 4.47E-06 | 0.75–1.00 | 6.67E-06 | 8.13E-05 | |
| 13 | 40 | 6.03E-06 | 0.2–0.3 | 3.96E-07 | 7.94E-06 | |
| 14 | 40 | 6.03E-06 | 0.4–0.6 | 2.36E-06 | 2.82E-05 | |
| 15 | 40 | 6.03E-06 | 0.75–1.00 | 6.67E-06 | 8.13E-05 | |
| 16 | 50 | 7.41E-06 | 0.2–0.3 | 3.96E-07 | 7.94E-06 | |
| 17 | 50 | 7.41E-06 | 0.4–0.6 | 2.36E-06 | 2.82E-05 | |
| 18 | 50 | 7.41E-06 | 0.75–1.00 | 6.67E-06 | 8.13E-05 |
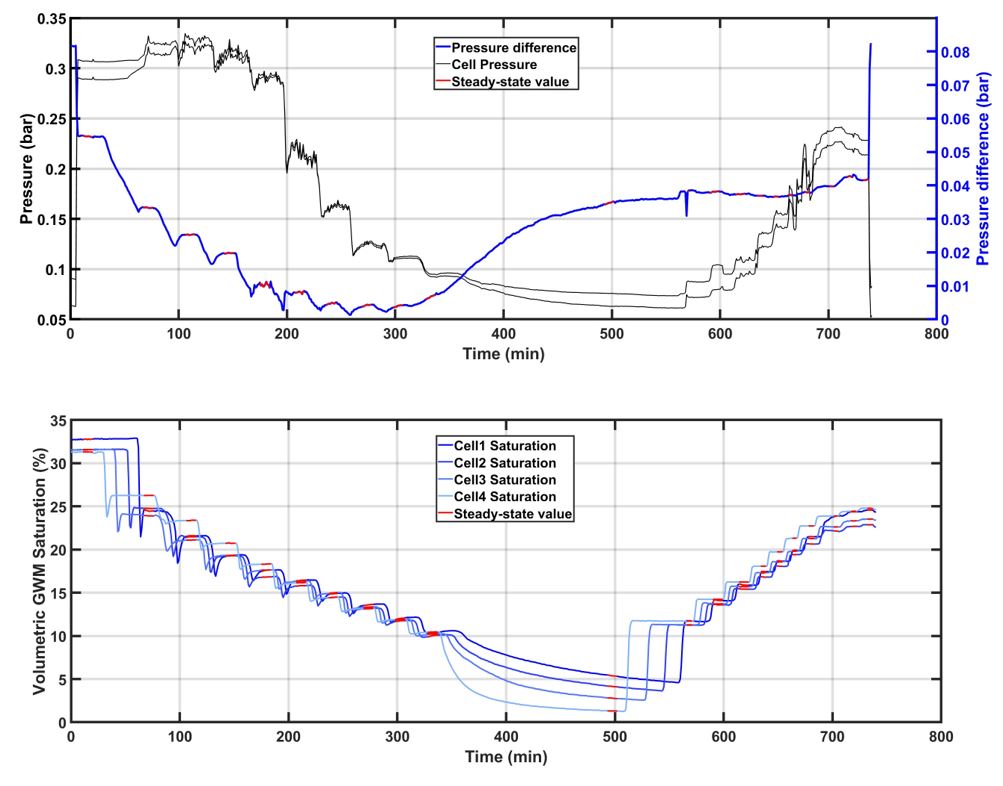
During the relative permeability tests, pressure and fluid saturation were measured at the center of each of the four cells and treated as representative values for the respective cells. Measurements were recorded in real time at 5 s intervals, allowing us to monitor the spatiotemporal evolution of pressure and saturation within the column throughout the experiments.
Results and Discussion
Saturation profiles
Fig. 2 presents the NWP saturation profiles measured in the four connected cells during the drainage process. At each stage, the ratio of the injected fluids was adjusted, and the NWP saturation was recorded once the saturation-sensor readings became steady-state. Data obtained at the final stage of drainage process (injecting NWP only) are highlighted using larger symbols.
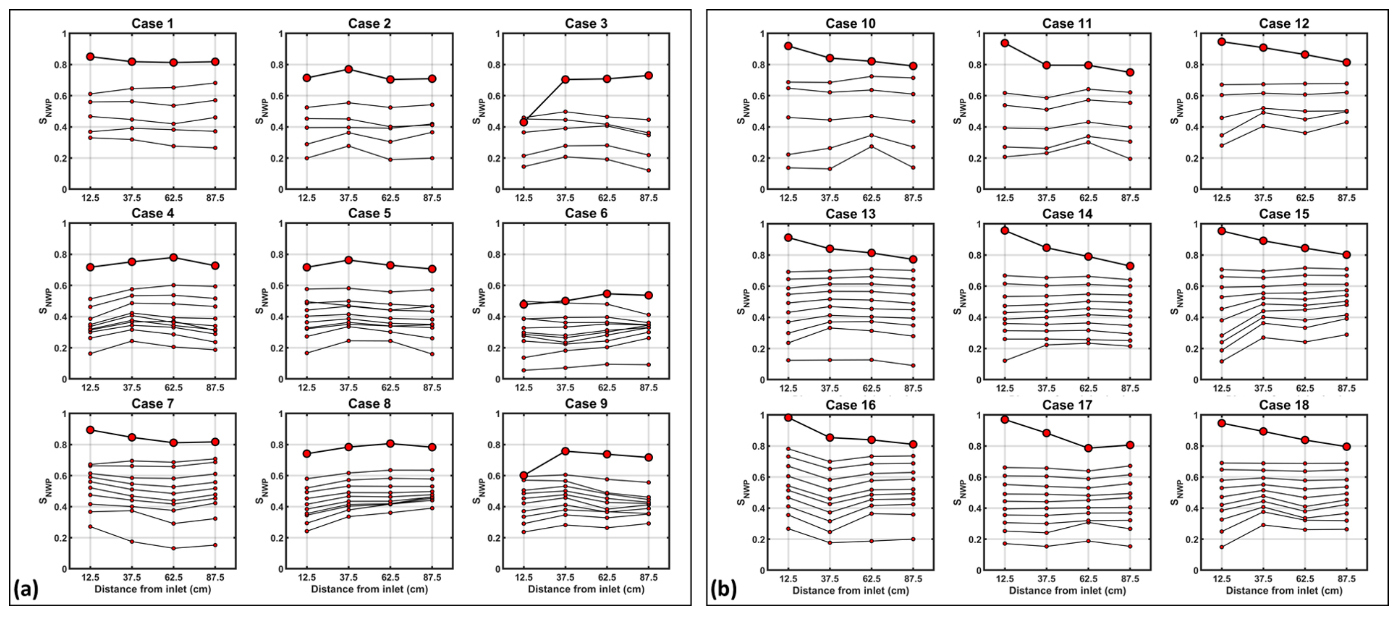
Fig. 2.
Non-wetting phase (NWP) saturation profiles measured at the center of each cell during the drainage process for nine experimental cases under (a) upward flow (cases 1–9) and (b) downward flow (cases 10–18). Small symbols denote steady-state saturations at each stage, and large symbols highlight the final drainage stage (100% NWP injection). For the lowest total flow-rate cases, only five stages were tested because of the long experimental time required to reach steady state.
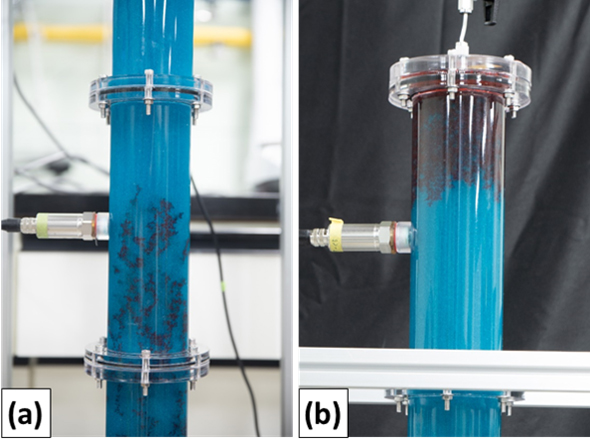
The NWP saturation increased stepwise with increasing NWP injection fraction under both flow directions. Under downward flow, saturation profile established at early stages was largely preserved as the NWP fraction increased. At the final stage of drainage process, the downward-flow cases exhibited the highest saturation near the inlet, followed by a monotonic decrease in saturation with increasing distance from the inlet. Such saturation gradients have been reported in small-scale CO2 injection experiments (Oh et al., 2013; Ott et al., 2015) and may be associated with a relatively stabilized piston-like flow when buoyancy acts against the flow direction (Wang et al., 2025). By contrast, under upward flow, the spatial consistency of the saturation profiles weakened as the stages progressed. At the final stage of drainage process, saturation did not always change monotonically with distance from the inlet. This behavior may reflect an irregular flow under upward flow, where buoyancy acts in the same direction as can enhance a gravity-driven instability, leading to spatially heterogeneous flow pathways (Nsir et al., 2012; Oh et al., 2015; Yang et al., 2021). Such piston-like and irregular flow behavior were also supported by flow-visualization observations, which provide representative examples of the upward and downward flow patterns (Fig. 3).
In the following analyses, we use averaged saturations measured at each cell. Nevertheless, as demonstrated by the saturation profiles, saturation is not spatially uniform along the column. This heterogeneity can influence the representativeness of mean saturation and contribute to uncertainty in estimating the kr–S relationship. Therefore, when interpreting and comparing the kr–S relationships across conditions, saturation distributions induced by flow direction and operating conditions should be considered.
Directional dependence of the kr–S relationship
Fig. 4 shows the steady-state relative permeability results for each experimental condition. The steady-state relative permeability test started from 100% WP injection. The NWP fraction was then increased stepwise to represent the drainage process (filled symbols). After reaching 100% NWP injection, the NWP fraction was decreased stepwise back to represent the imbibition process (open symbols).
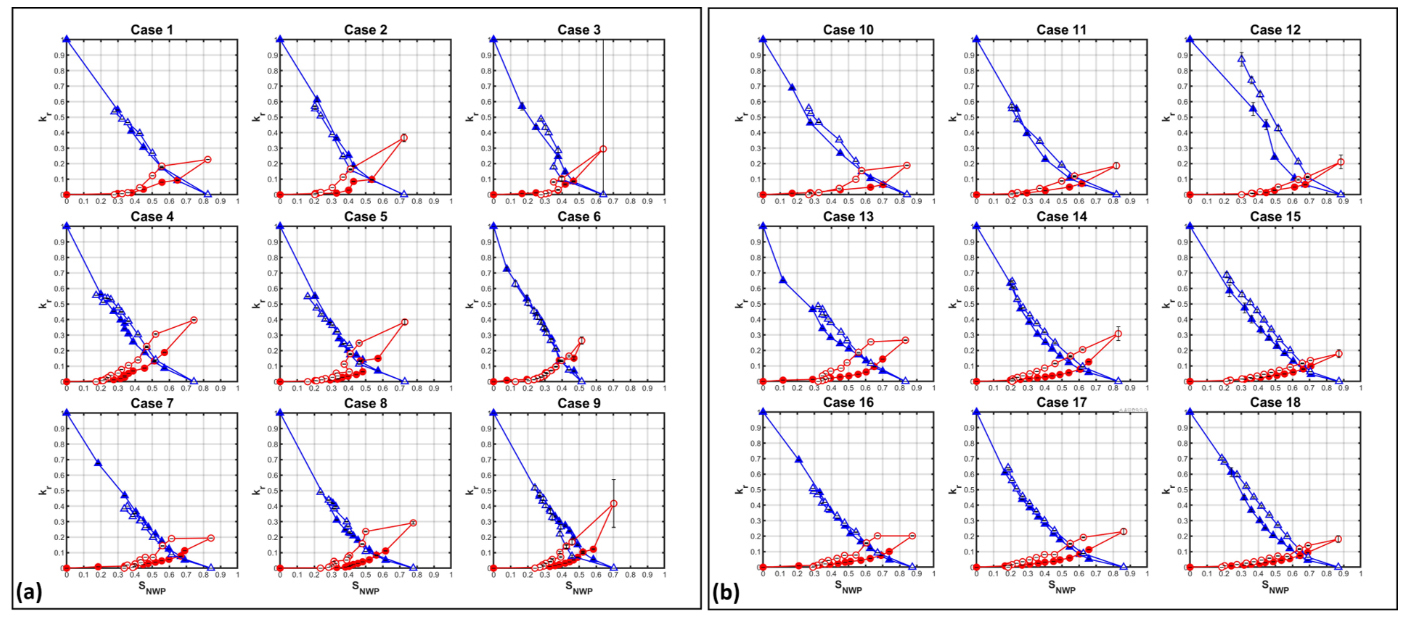
Fig. 4.
Relative permeability–saturation (kr–S) relationships for nine experimental cases under (a) upward flow (cases 1–9) and (b) downward flow (cases 10–18). Red and blue denote the non-wetting phase (NWP) and wetting phase (WP), respectively. Filled and open symbols represent the drainage and imbibition processes, respectively.
Overall, the measurements follow the expected kr–S trends, indicating that the experiments captured typical two-phase relative permeability behavior. However, even under the same ki and the same Qtot, the kr–S relationships differed between upward and downward flow, demonstrating that the kr–S relationship is direction-dependent. Because viscous and capillary conditions were controlled, the observed directional contrast is primarily attributed to gravitational effects. This result corresponds to previous results by Adebayo et al. (2017) hich measured the relative permeability in homogeneous and isotropic rock sample depending on the flow directions, vertical upward and horizontal.
The stage-to-stage evolution also differed between flow directions: downward-flow cases generally exhibited gradual changes in saturation and relative permeability across stages, whereas upward-flow cases showed larger scatter and occasional abrupt changes. This behavior is consistent with the saturation-profile observations in Section 3.1 and is interpreted to reflect enhanced flow instability under upward flow, where gravity acts in the opposite direction as injection and promotes spatially variable flow paths. Directional differences in kr–S relationship were most pronounced under conditions of high ki and low Qtot, (case 3 and case 12), where gravity is expected to be relatively more influential than viscous and capillary forces. In contrast, under low ki and high Qtot conditions (case 7 and case 16), the kr–S relationships from upward and downward flow were comparatively similar, suggesting that displacement was governed predominantly by capillary.
Hysteresis in the kr–S relationship is important because it is closely linked to residual trapping during immiscible two-phase displacement (Cihan et al., 2018; Ott et al., 2015; Yang et al., 2025) and can lead to substantial uncertainty of storage performance when neglected in reservoir-scale simulations (Lysyy et al., 2023). In our results, hysteresis over one drainage–imbibition cycle was generally more pronounced for the NWP than for the WP. For the NWP, hysteresis tended to weaken with increasing ki under downward flow, whereas no distinct consistent trend was identified under upward flow. Although hysteresis was not quantified in this study, the kr–S relationships exhibit condition-dependent differences across flow direction, Qtot, and ki, suggesting that hysteresis may vary systematically with these factors.
Relations with dimensionless numbers
In this section, the results are interpreted using dimensionless numbers to compare trends across flow direction, Qtot, and ki. In vertical two-phase flow, the driving force for each phase is governed by the gradient of hydraulic potential. Because the WP and NWP have different densities, gravity introduces different body-force contributions for the two phases, which can modify the effective pressure–potential gradients and thereby the displacement stability and phase connectivity. We therefore use Bo and Ca to compare the relative importance of gravity, viscous, and capillary effects across the tested conditions.
Table 3 summarizes results of four selected variables, maximum NWP saturation (Smax,NWP), residual NWP saturation (Sres,NWP), endpoint relative permeability of the NWP (kr,end,NWP), and endpoint relative permeability of the WP (kr,end,WP). Here, Smax,NWP is defined operationally as the NWP saturation measured at the end of the final drainage stage under NWP-only injection after the pressure and saturation signals satisfy the steady-state criterion described in the Appendix. In this study, Smax,NWP is used as a practical drainage endpoint for comparing conditions, rather than being claimed as a definitive bounding-state endpoint that strictly defines irreducible WP saturation for all cases.
Table 3.
Results of selected variables and associated statistics for each case
Fig. 5 plots these variables against log(Bo/Ca). Here, Bo and Ca denote the gravity-to-capillary and viscous-to-capillary force ratios, respectively. Therefore, Bo/Ca (equivalent to a gravity number) provides a compact measure of the relative dominance of gravity over viscous forces, with capillary effects normalized through the ratio. Monotonic trends with log(Bo/Ca) are assessed using Spearman’s rank correlation, and 95% confidence intervals (CI) for ρ are estimated by bootstrap resampling (n = 10,000).
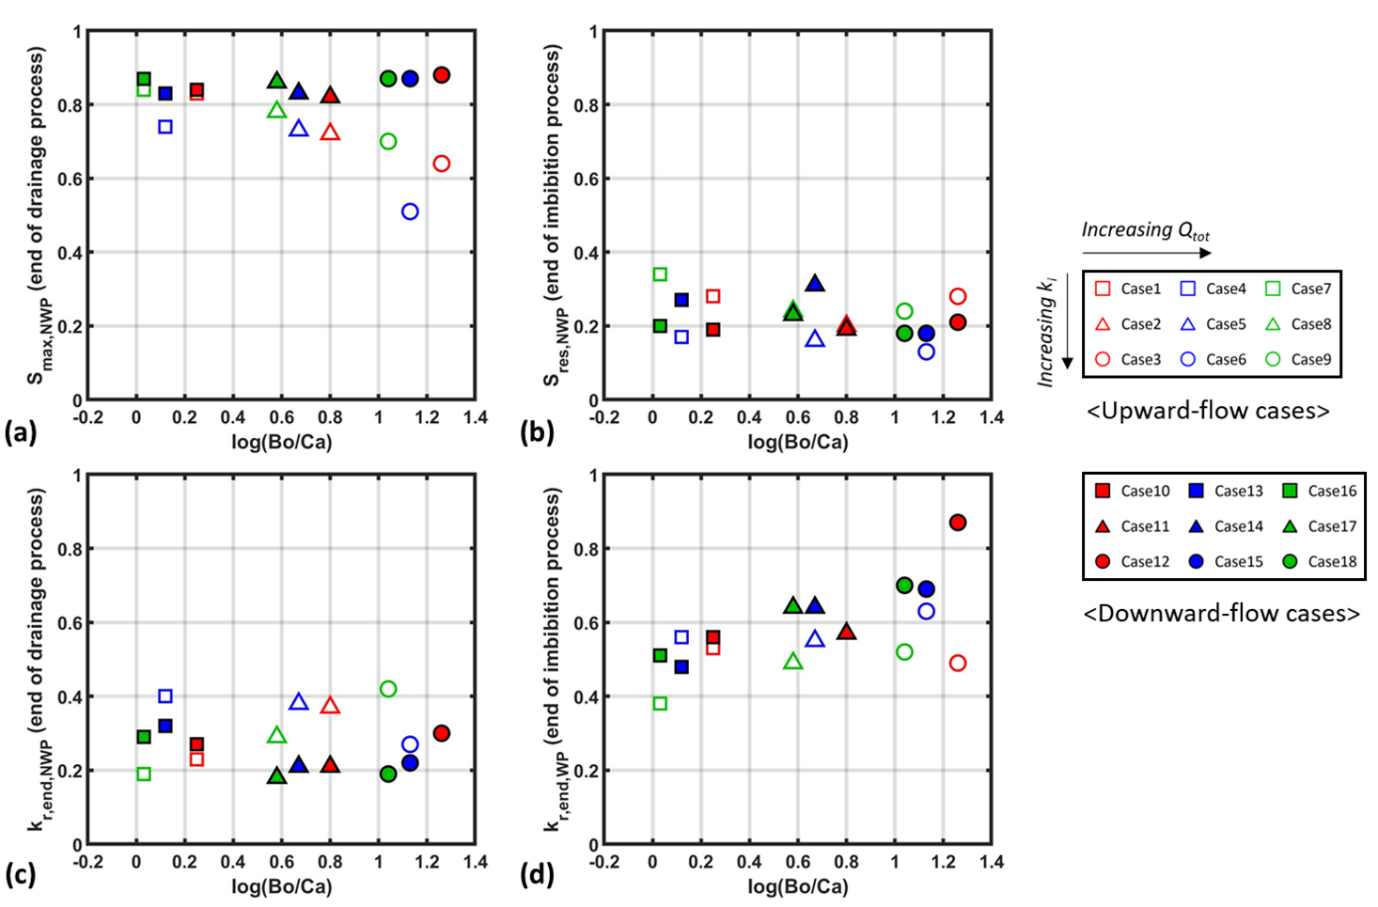
Fig. 5.
Relationships between log(Bo/Ca) and selected variables: (a) maximum NWP saturation at the end of the drainage process; (b) residual NWP saturation at the end of the imbibition process; (c) NWP end-point relative permeability at the end of the drainage process; and (d) WP end-point relative permeability at the end of the imbibition process. Open and filled symbols indicate upward- and downward-flow conditions, respectively. Symbol shape denotes intrinsic permeability, increasing from square to triangle to circle, and symbol color denotes total flow rate, increasing from red to blue to green.
Fig. 5 Relationships between log(Bo/Ca) and selected variables: (a) maximum NWP saturation at the end of the drainage process; (b) residual NWP saturation at the end of the imbibition process; (c) NWP end-point relative permeability at the end of the drainage process; and (d) WP end-point relative permeability at the end of the imbibition process. Open and filled symbols indicate the upward- and downward-flow conditions, respectively. Symbol shape denotes intrinsic permeability, increasing from square to triangle to circle. Symbol color denotes total flow rate, increasing from red to blue to green.
Saturation of the non-wetting phase
Smax,NWP was defined as the value obtained at the final stage of the drainage process. Under downward-flow conditions, Smax,NWP remained consistently high (0.82–0.88) across all cases. This is consistent with previous experimental studies by Xiaolong et al. (2021), which indicate that buoyancy opposing the flow direction stabilizes the plume front and promotes more uniform advancement. In this sense, front instability may be relatively suppressed under downward flow, which could contribute to the higher Smax,NWP observed here. In contrast, under upward-flow conditions, Smax,NWP generally decreased with increasing Bo/Ca, and Spearman’s rank correlation indicated a significant negative relationship (ρ = –0.933, 95% bootstrap CI [–1.000, –0.579], p = 2.36×10⁻⁴). An increase in Bo/Ca can arise from either an increase in ki (increasing Bo) or a decrease in Qtot (decreasing Ca). In the results, the dependence on Qtot was less consistent, whereas Smax,NWP tended to decrease more clearly with increasing ki. Thus, within the tested range, permeability appears to be more strongly associated with the reduction in Smax,NWP. This trend is consistent with the expected effect of ki on capillary control of the flow front. Higher ki implies larger characteristic pore sizes and lower capillary pressure, thereby weakening capillary stabilization of the NWP front (Leverett, 1941). As capillary control weakens, the front may become more unstable and the NWP may preferentially invade limited pathways rather than spreading broadly, enhancing channeling (Lenormand et al., 1988; Stöhr and Khalili, 2006). Consequently, the NWP fills a smaller fraction of the pore volume, leading to lower Smax,NWP. Buoyancy acting in the same direction as injection under upward flow may further promote front instability, amplifying the observed reduction in Smax,NWP.
Sres,NWP showed similar mean values for upward and downward flow (0.23 and 0.22, respectively). No systematic variation was observed with flow direction, Qtot or ki, and no statistically significant correlations with these variables were identified within the tested range. This suggests that, despite the directional influence of gravity on displacement patterns, the residual NWP saturation in these experiments is likely controlled largely by capillary trapping associated with pore-scale geometry and pore-throat characteristics.
End-point relative permeability
kr,end,NWP, defined as the NWP relative permeability at the final stage of the drainage process, ranged from 0.18 to 0.42 under both upward and downward flow. Unlike Smax,NWP, however, kr,end,NWP did not exhibit a clear relationship with Bo/Ca. Under upward flow, front instability and channeling can drive reorganization of flow pathways not only when the flow-rate ratio is changed between stages, but also within a given stage during the transient adjustment toward steady state. As a result, kr,end,NWP may be governed primarily by the effective conductance of the limited connected pathways that remain active at the endpoint, whereas locally stranded NWP can persist in adjacent pores as a consequence of earlier pathway variability and disconnection (Berg et al., 2016; Gao et al., 2019; Glover et al., 2025). Accordingly, Smax,NWP and kr,end,NWP may not vary in a one-to-one manner over the tested range of Bo/Ca.
kr,end,WP was defined as the WP relative permeability at the final stage of the imbibition process. Notably, under downward flow, Sres,NWP did not show a significant association with Bo/Ca, whereas kr,end,WP increased with increasing Bo/Ca (ρ = 0.912, 95% bootstrap CI [0.540, 1.000], p = 6.07×10⁻⁴). This pattern suggests that, even when the residual amount is similar, the spatial configuration of the remaining NWP (e.g., distribution, connectivity, and the degree of disconnection into stranded clusters) may differ, which could alter the effective connectivity and tortuosity of WP flow pathways and lead to different endpoint relative permeabilities (Krevor et al., 2015; Eliebid et al., 2024). In a mechanistic sense, an increase in Bo/Ca, arising from either higher ki or lower Qtot, can modify the pore-scale displacement history and the resulting configuration of stranded NWP, thereby altering the effective connectivity and tortuosity of WP flow pathways and ultimately kr,end,WP (Krevor et al., 2015; Ruspini et al., 2017; Eliebid et al., 2024). This interpretation is consistent with Section 3.3.1, which indicates that higher ki weakens capillary control by increasing characteristic pore sizes, and that lower Qtot reduces viscous forcing. These changes can promote more preferential pathway of WP during the downward imbibition and modify the distribution and connectivity of stranded NWP, thereby altering WP connectivity and increasing kr,end,WP.
Finally, we note that the imbibition curves should be interpreted with reference to how the drainage endpoint is defined. Under downward flow, the relatively stable displacement and consistent endpoint saturations suggest that the imbibition data approximate a bounding curve for the present packing and experimental timescales. Under upward flow, where front instability and pathway reorganization persist, the measured endpoint saturation can be more variable and the subsequent imbibition curves are more appropriately interpreted as scanning curves. Even if the upward-flow endpoints are treated as operational, potentially scanning states rather than strict bounding endpoints, the experiments still indicate a robust directional effect. Flow orientation changes displacement stability and the resulting saturation configuration, and these differences are reflected in the measured kr–S relationships.
Limitations of this study
First, pore-scale saturation is inherently heterogeneous under two-phase flow. Because the present measurements represent average saturation over a finite sensor sampling volume, the inferred saturations may not fully capture pore-scale distributions and connectivity. In addition, saturation gradients may develop along the column, which may propagate uncertainties in estimated relative permeability. In our assessment, this uncertainty becomes more noticeable when the hydrostatic pressure contribution exceeds the viscous pressure drop (i.e., under conditions with relatively stronger gravitational effects), particularly for upward flow. Higher-resolution approaches (e.g., smaller sampling volumes or imaging-based mapping such as x-CT or MRI) would improve measurement fidelity (Gao et al., 2019; Kim et al., 2018) and reduce the uncertainties. Second, the generalizability of the present findings is limited by the number of experiments. To better quantify gravitational effects, additional tests spanning a wider range of conditions are required. A larger dataset, including replicate experiments, is also needed to enable more robust statistical evaluation of the observed trends. Third, the experiments were conducted at ambient pressure and temperature using surrogate fluids, whereas reservoir scCO2–brine systems exhibit pressure–temperature–salinity-dependent properties, including scCO2 compressibility and variable IFT. These thermodynamic differences may alter pore-scale displacement and kr–S behavior relative to in-situ conditions. Finally, the experiments were conducted only for the two vertical flow directions (upward and downward), where gravity effects are expected to be strongest. Because field-scale multiphase flow can occur over a range of flow orientations, generalization of present findings would require extending the directional dependence of the kr–S relationship across a broader range of flow directions (e.g., 0–180°) and representing the directional behavior in a functional form suitable for numerical modeling (Song et al., 2023; Suekane et al., 2015; Suwandi et al., 2022).
Conclusion
We performed vertical steady-state relative permeability tests in a homogeneous, glass-bead-packed column instrumented with pressure and saturation sensors to examine directional dependence of the kr–S relationship under gravity. The measured kr–S relationships followed typical two-phase trends but differed between upward and downward flow even at identical ki and Qtot. The strongest directionality observed under high-ki and low-Qtot conditions where gravitational effects are expected to be relatively more influential. Using log(Bo/Ca) as a compact measure of gravity-to-viscous dominance, Smax,NWP under upward flow decreased significantly with increasing Bo/Ca, whereas Smax,NWP under downward flow remained consistently high. kr,end,NWP exhibited no clear trend with Bo/Ca, while kr,end,WP under downward flow increased with Bo/Ca despite similar residual saturations. These results suggest that flow instability modified due to the gravity respected to the flow direction, resulting residual distribution, and its connectivity can influence the relative permeability. These findings highlight that flow direction can alter both saturation distributions and kr–S relationships in vertical two-phase flow.