

Introduction
Mine Arrangement
Numerical Method and Procedures
Numerical Method and Procedures
Turbulence modeling and solution convergence
Numerical grid independency and method
Numerically Predicted Flow Structures and SF6 Diffusion
Comparison of numerical and experimental results
Structural characteristics of air flow in entire mine
Structural characteristics of vorticity and eddy viscosity in entire mine
Turbulent dispersion of SF6 in entire mine
Summary and Conclusions
Introduction
The main purpose of mine ventilation is providing fresh air to workers in mines. The other purpose is reducing dust or gases that are very harmful to human. To address these issues, two types of fans are used in modern mines: main fans and local fans. Main fans are installed to provide fresh air to the entire mine. However, more fresh air is needed as the depth of the mine increases and consequently the area percentage that the main fan can cover decreases. Local fans are required to provide fresh air in the local area that the main fan cannot cover. Local fans are usually located in galleries near mining faces in mines to reduce dust and gases and provide fresh air. Even though many studies have presented good data for understanding local mine ventilation, our knowledge on turbulent flow, ventilation problems, and gas diffusion of entire-mine ventilation remains incomplete. The present study is aimed at partially addressing this deficiency.
Parra et al. (2006) compared the experimentally measured and numerically predicted velocity profiles in a coal mine. By using hot-wire anemometry, valuable experimental data were produced in a real mine. Numerical results obtained using the Spalart–Allmaras turbulent model show good agreement on the calculated planes for the compared numerical and experimental data. Arpa et al. (2008) performed the SF6 tracer gas experiment to measure the effective turbulent diffusion coefficient of airflow paths in an underground gold mine. The numerical results demonstrated that the profiles of mean velocity, velocity fluctuations, and Reynolds stress yield diffusion coefficients of 4–200 m2/s. Widodo et al. (2008) conducted SF6 tracer gas experiments on airways and predicted the turbulent diffusion coefficient. They demonstrated that the turbulent diffusion coefficient is proportional to the length/diameter (L/D) of a mine. Sasaki et al. (2008) simulated the numerical experiment of the tracer gas diffusion with the aim of predicting the effective turbulent diffusion coefficient in a mine. The numerical simulation results revealed that the turbulent velocity strength and velocity profile contribute to the effective diffusion coefficient. Niu et al. (2011) conducted a gas–solid two- phase flow simulation at the mining face. The commercial code FLUENT exhibited good agreement between the numerical and experimental values. Torano et al. (2011) presented a numerical simulation of coal dust distribution in the mine tunnel with blowing, exhausting, and continuous mining. The results revealed the air flow rate of the ventilation ducts and the distance between the exhaust duct and the mine floor; the distance between the working face and ventilation ducts should be considered to increase ventilation efficiency in the mine. Diego et al. (2011) compared the numerical and experimental data in the mining face of a mine. They predicted the pressure loss using computational fluid dynamics (CFD) when the road headers, dumpers, and excavators were working. Torno et al. (2013) performed a numerical analysis of the distribution of carbon dioxide via the ventilation ducts in a mine. They presented a new mathematical model that could predict the distribution of carbon dioxide depending on variables such as explosives mass, cross-sectional area, and airflow. Kurnia et al. (2014a) presented the methane distribution in underground mine faces via CFD and demonstrated that methane dispersion is influenced by the location and quantity of methane. Moreover, they compared the numerical and experimental data. Kurnia et al. (2014b) provided a mathematical model for the distribution of methane and temperature in underground mines. They analyzed the methane distribution based on the location of ventilation ducts. Moreover, the results of the parametric study of tail pipe position are presented for continuous miner and shuttle cars in the presence of blowing and suction ducts. Xu et al. (2015) compared the experimental results with the CFD modeling results of the SF6 tracer gas to estimate the damage level of ventilation in the gallery of a mine. They have also demonstrated that the CFD modeling results obtained using laboratory and field experimental values are feasible. Park et al. (2016) performed a numerical analysis using mean age of air (MAA) to study the parameters of the blowing duct in a mine tunnel. MAA indicates the freshness of air in a quantitative analysis of air quality. The results indicated that vortical flow increases MAA; therefore, minimizing vortical flow in the mine tunnel via the blowing duct is crucial. Lee et al. (2018) performed an analysis of ventilation efficiency in an underground limestone mine with ventilation shafts where a main fan was working. The results revealed the monitoring velocity and temperature inside the portal, rampway, and ventilation shaft bottom. In addition, the results of the SF6 tracer gas experiment in a long-range (1912 m) mine revealed that the turbulent diffusion coefficient for gas dispersion is very large. Park et al. (2018) performed a parametric study of location and velocity of the blowing duct using CFD in a mine tunnel with a mining face. The numerical analysis result shows a vortical flow between the mining face and the ventilation duct to increase the MAA, and the eddy viscosity and total pressure show a strong mixture of air in vortical flows. In addition, the results of the parametric study of ventilation ducts revealed that the MAA is low when the ventilation duct is located at the top of the tunnel center. Yi et al. (2020) performed a parametric study on the characteristics of ventilation efficiency via the exhaust duct to lower the MAA in the area where vortical flows were generated within the mine tunnel. These results indicate that exhaust ducts should be located in a manner to capture the old air that makes a single, large vertical flow pattern. Kim et al. (2021) presented local airflow analysis in case of two ducts. These ducts serve as both blowing and exhaust ducts. Yi et al. (2022) reviewed many papers related to local ventilation of mines using computational fluid dynamics.
Most studies focus on the local ventilation of mines, and only a few papers address the overall airflow within the mine. This is because the ventilation experiments in the entire mine are complex and difficult. The numerical results in the present study provide new and additional information on flow structures, showcasing the airflow throughout the entire mine. These characteristics encompass velocity distributions, streamlines, total pressure, vorticity, and eddy viscosity, along with a comparison of numerical simulations and experiments conducted in an entire mine. Due to the challenging nature of measuring these quantities in actual mines, the present investigation stands out as distinct and valuable compared to many other existing studies.
Mine Arrangement
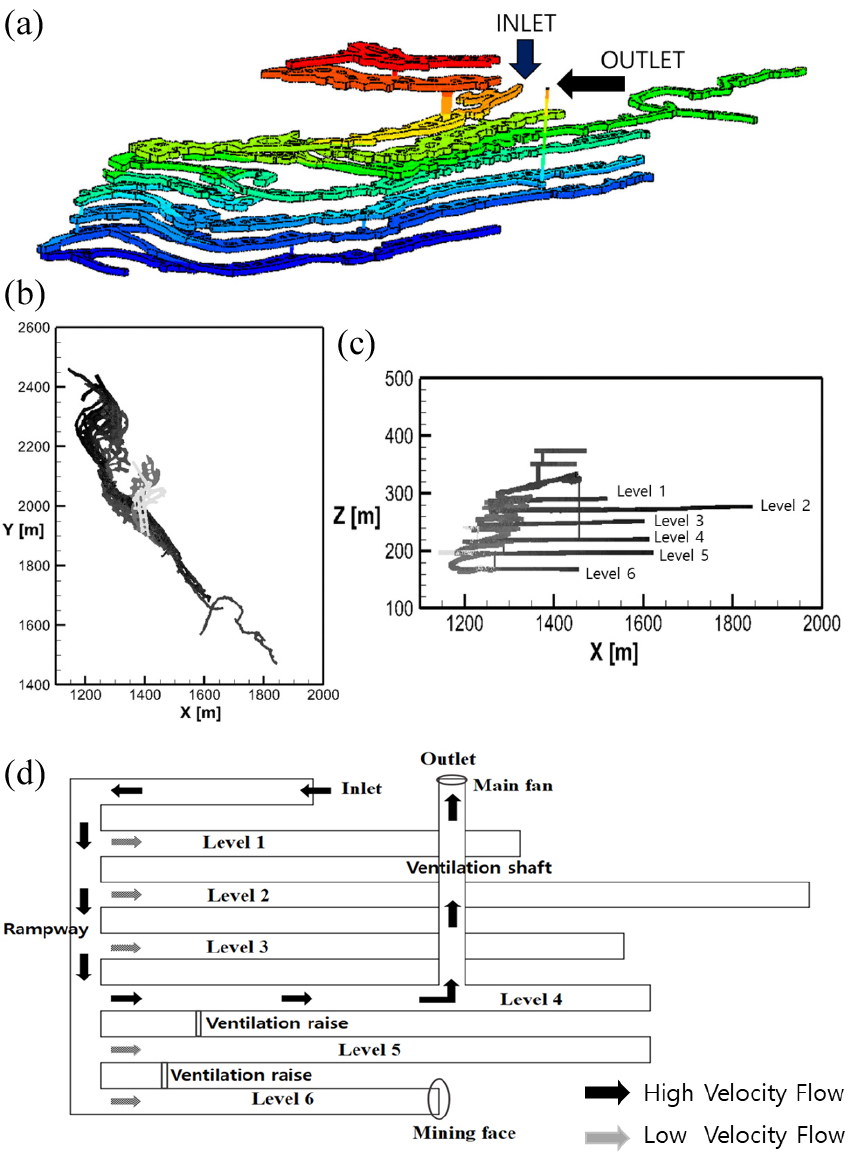
Fig. 1 shows the geometry of a testbed mine in Korea. The depth and length of this mine is approximately 250 m and 1100 m, respectively. An inlet of this mine is shown in orange in Fig. 1(a). The width and height of the mine tunnels are approximately 9 m and 7 m, respectively. These width and height values change slightly within the mine. The outlet of these galleries is located by the inlet. This is indicated in orange in Fig. 1(a). At the outlet, a main fan (Epiroc, AVH125) is installed. The diameter of the fan is 1250 mm, and it has a volumetric flow of 28.9 m3/s, power of 67 kW, and pressure of 1848 Pa. The shape of the entire mine spans all three axes. Fig. 1(b) shows the entire mine from the sky. The side view is presented in Fig. 1(c). Until now, six levels have been developed for the mine limestone. Fig. 1(d) presents the schematic of the entire mine (not to scale). The main fan is located in the end of the ventilation shaft, which is close to the outlet. The main flow of the air is from the inlet to the rampway, Level 4, ventilation shaft, and outlet. Both Level 5 and Level 6 are connected to Level 4 through ventilation raises. Levels 1, 2, 3, 4, and 5 are already developed for limestone, and only Level 6 is a tunnel with mining faces. A main fan is constructed for the exhaustion of air, which pulls out the air to the ambient atmosphere.
Numerical Method and Procedures
The ANSYS CFX commercial code, version 2020, is used for all numerical calculations. ANSYS Meshing 2020 is used to create the numerical grids to solve the related equations.
Numerical Method and Procedures
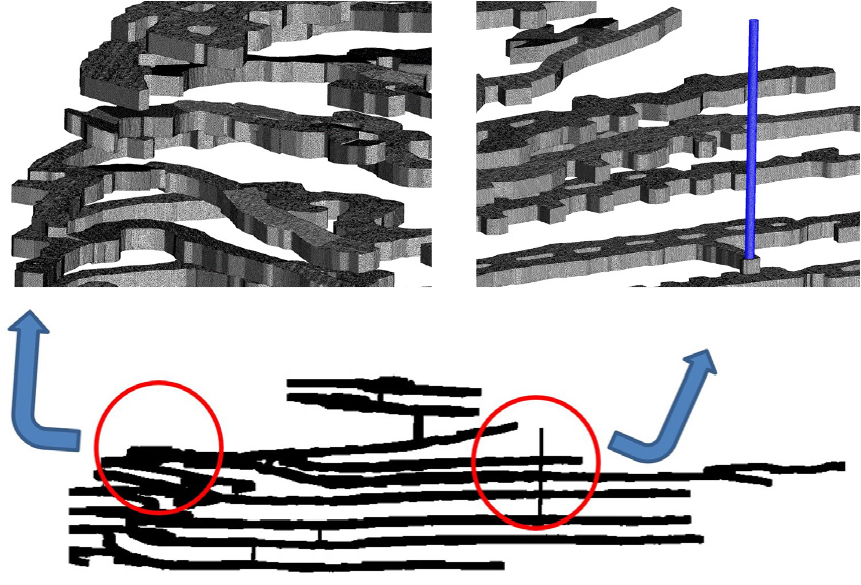
In ANSYS CFX, the continuity and momentum equations are discretized using the finite volume method and solved implicitly. For numerous years, this software has maintained its popularity, demonstrated by its widespread usage in a multitude of engineering studies. Fig. 2 presents a side view of the numerical grids that provide air flow. The left side of the figure shows the portion of the rampway that connects the developed levels. The right side contains one inlet and one outlet. At this outlet, the main fan is installed to expel the dirty air. The grid is made up of tetrahedral elements because the geometry of mine tunnels is extremely complicated. Near-wall surfaces are meshed in a hexagonal manner to improve the quality of numerical predictions. In total, 15,000,000 tetrahedral cells are used for simulation of the entire mine tunnels.
Turbulence modeling and solution convergence
The shear stress transport (SST) k - ω model is employed to solve the turbulence equations (Wala et al., 2007). As the predictive capabilities of the SST model is excellent compared to the standard κ - ε or k - ω model. The SST k - ω presents better prediction of flow physics for both the near-wall and the far-field regions. All computational iterations are implicitly solved. High resolutions of the advection scheme and the turbulence numbers are chosen to reduce the numerical errors. Scaled residuals of the continuity and momentum equations and the turbulent variables determine the convergence of the computational iterations. The criteria of the scale for deciding the convertgence is 10-4 for all equations. The solutions to all equations are considered to be converged when the scaled residuals are less than 10-4.
Numerical grid independency and method
In order to achieve a converged solution that is independent of the numerical grid resolution, three distinct grid sizes (0.5 M, 15 M, and 18 M) are examined. These meshes are tetrahedral and pyramidal in nature. The final mesh size of 15 M enables the attainment of optimal solutions for air velocities and turbulent variables, thanks to its ability to converge within a short calculation time. The momentum equations of the air flow with 15 M grids are solved in the steady state.
Based on these results, the SF6 dispersion is solved in the unsteady state with the 3.5 M grid. The convergence time for the 15 M grid is very long when it is solved in the unsteady state. The 3.5 M grid can be used for achieving good results as it has the shortest convergence time.
Numerically Predicted Flow Structures and SF6 Diffusion
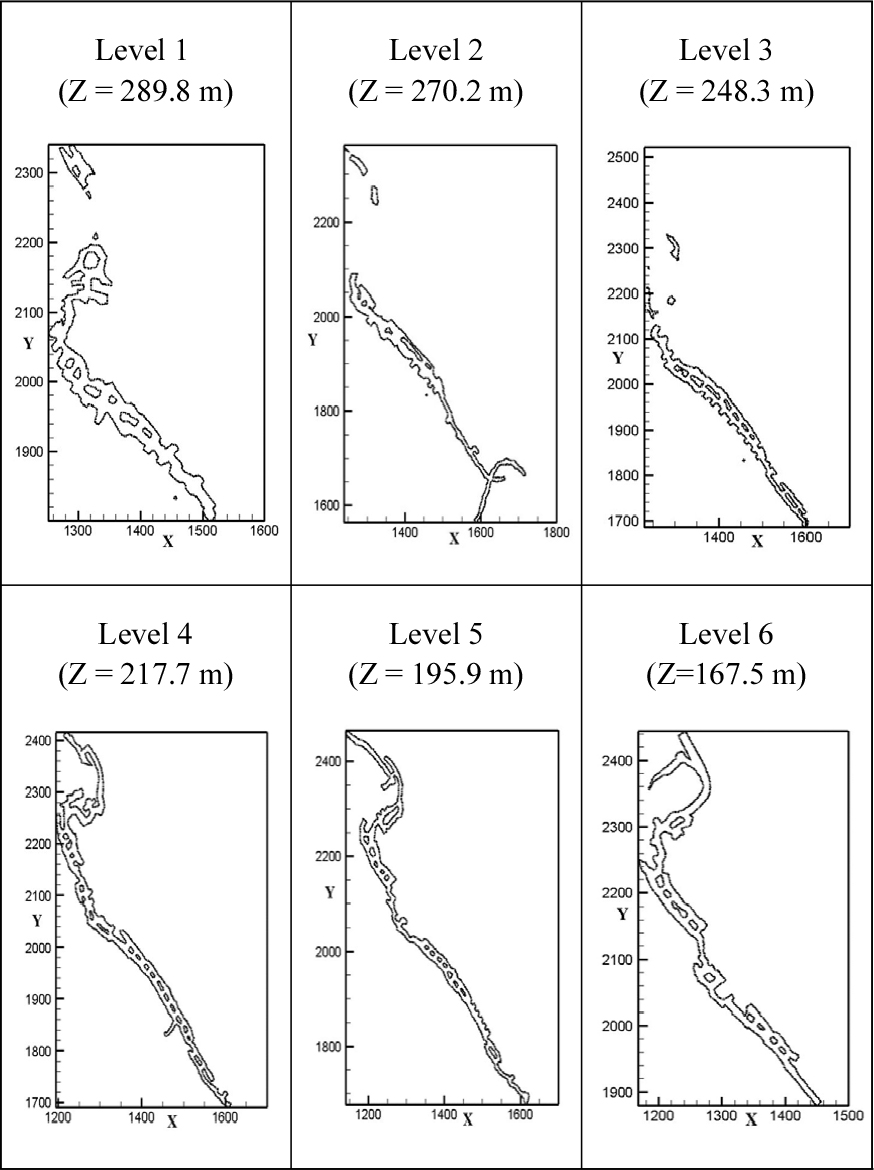
Fig. 3 shows the computational planes used to calculate velocity profiles and turbulent variables. All six levels shown in Fig. 1(c). For calculation, Level 1 is the plane of Z = 289.8 m. The plane of Levels 2, 3, 4, 5, and 6 are Z = 270.2 m, 248.3 m, 217.7 m, 195.9 m, and 167.5 m, respectively. The rampway portions for connecting levels are located at 2200 m < Y < 2400 m. The height of one level is approximately 9 m. Level 1 is very close to the inlet of the entire mine. The area of mining is to the point of X = 1500 m in the tunnel of Level 6.
Comparison of numerical and experimental results
Table 1 presents the comparison of experimental and numerical results. Air velocities are measured at two locations in this mine. One is the portal entry station, where the inlet of this mine is located. This is the opposite to the outlet, where the exhaust fan is installed. The ventilation shaft is established between the outlet and Level 4, as shown in Fig. 1(d). The other point of air velocity measurement is the bottom station of the shaft connected to the outlet of this mine. To obtain velocity distributions in a mine is difficult because the tunnel walls are very rough, and measuring the air properties is difficult. Only a few studies have provided experimental data for measuring air velocities (Arpa et al., 2008; Widodo et al., 2008; Sasaki et al., 2008; Xu et al., 2015; Lee et al., 2018). The experimental values, as obtained by Lee et al. (2018), are 0.61 m/s and 0.51 m/s for the portal entry and shaft bottom station, respectively. These values on ANSYS CFX are 0.56 m/s and 0.49 m/s, respectively. Table 1 lists the velocities of air calculated using CFD herein, and they are in good agreement with Lee et al. (2018)’s results.
Table 1.
Comparison of experimental and numerical results for air velocities in the entire mine
| Experiments (Lee et al., 2018) | Numerical simulations | |
| Portal entry station | 0.61 m/s | 0.56 m/s |
| Shaft bottom station | 0.51 m/s | 0.49 m/s |
Structural characteristics of air flow in entire mine
Fig. 4 shows the velocity distributions at computed planes, for all six levels (1–6). At 2200 m < Y < 2400 m, a rampway is shown to connect all levels in Fig. 1(d). The air enters at the inlet and moves to the rampway. At Level 4, the air goes out through the vertical shaft due to the main fan. At Level 1, the air has a velocity of 0.3–0.5 m/s in the rampway; however, small values of velocities are shown in the Level 1 tunnel. The same trends are calculated at Levels 2 and 3. At 2200 m < Y < 2400 m and 1200 m < X < 1300 m, a rampway exists, and the velocity of the air is faster here. However, in the tunnels of Levels 2 and 3, the velocities of the air are very slow and at a standstill. At Level 4, the magnitude of the air velocity is 0.3–0.5 m/s. Especially, the portion connecting Level 4 with a vertical shaft shows a high magnitude of air velocity. As the main fan is installed at the end of the vertical shaft, the velocities of the exhausted air are high value. The air velocities at Levels 5 and 6 are 0–0.2 m/s. As Level 6 is the mining place of this mine, the air flows very slowly therein. This has a detrimental effect on the miners’ health. Dust and hazardous gases are not exhausted to the outlet owing to the slow velocity of the air. To solve this problem, a few local fans are recommended to exhaust the dirty and harmful air.
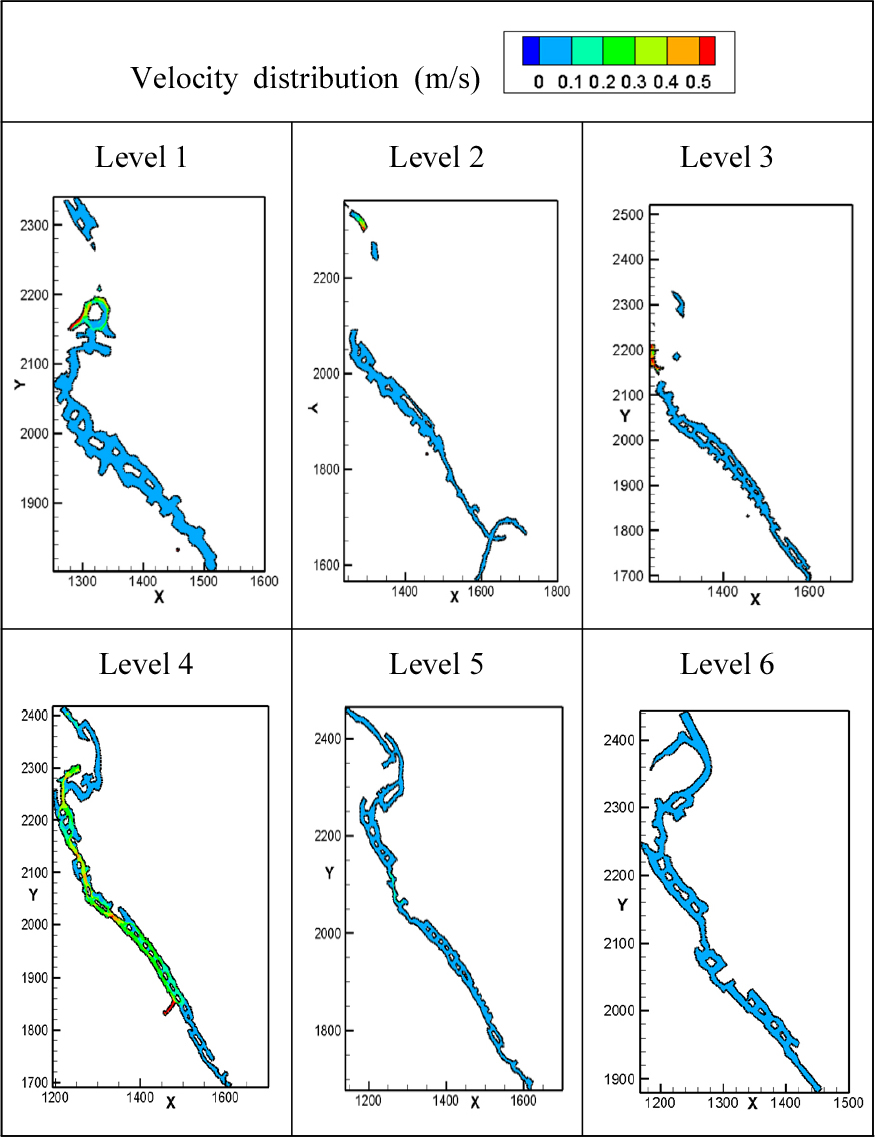
Fig. 5 shows the streamlines at the computed planes, for all six levels (1–6). The X and Y coordinate unit is in meter (m). The rampway, which is connected all levels, is located at 2200 m < Y < 2400 m and 1200 m < X < 1300 m. The air velocity around the rampway is very high. Overall, it has a high magnitude at both the rampway and Level 4, where it is very close to the inlet and the outlet of the air. The fresh air enters at the inlet and moves to the rampway and exhaust at the outlet shaft in Level 4. Except for these three portions, air velocity is extremely low at these 5 levels (1, 2, 3, 5, and 6). Even though its magnitude is very low, the flow is very complicated owing to galleries with dead ends. At Level 1, the air is circulated around the pillars and vortices are generated in the small dead-end galleries. These trends are very clear at Levels 2 and 1. Several small vortices are shown in the tunnels and single circular motion are present around the pillars. At Level 4, the air flow shows different distributions owing to the shaft of the exhaust. The outlet installed with the main fan, which has a volumetric flow of 28.9 m3/s and power of 67 kW, is directly connected to this shaft of exhaust. All streamlines in Level 4 stop at the shaft, which is located at X = 1450 m and Y = 1825 m. Almost all air volumes are exhausted through this main fan. There are places where the miners are working in Level 6. This is the tunnel with the mining face. Except for Level 6, the mining is finished for other levels. Level 6 has only and one mining face. This level has a small ventilation raise that is connected to Level 5. However, the effect of this hole is almost small.
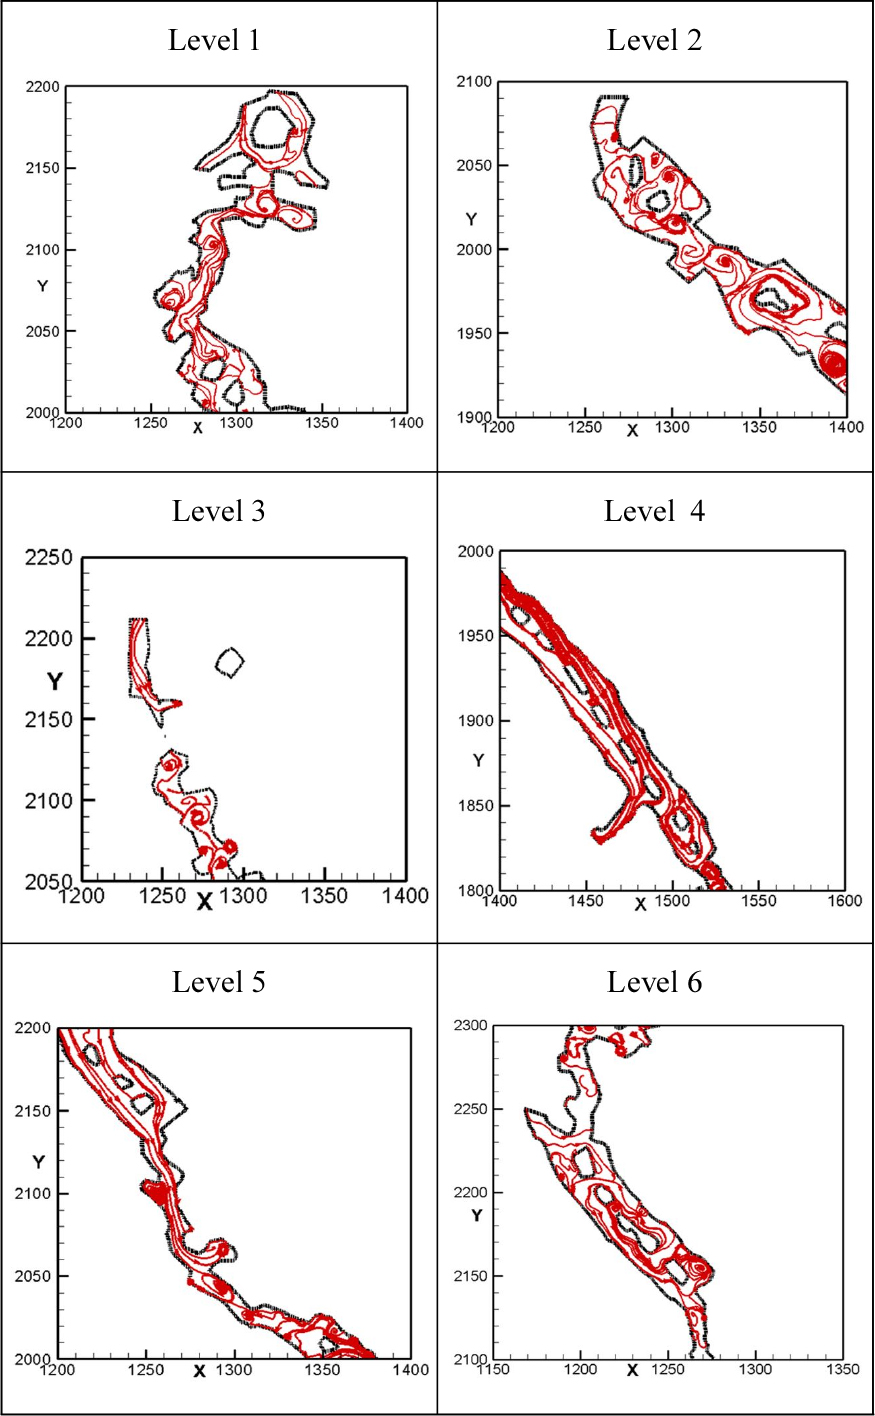
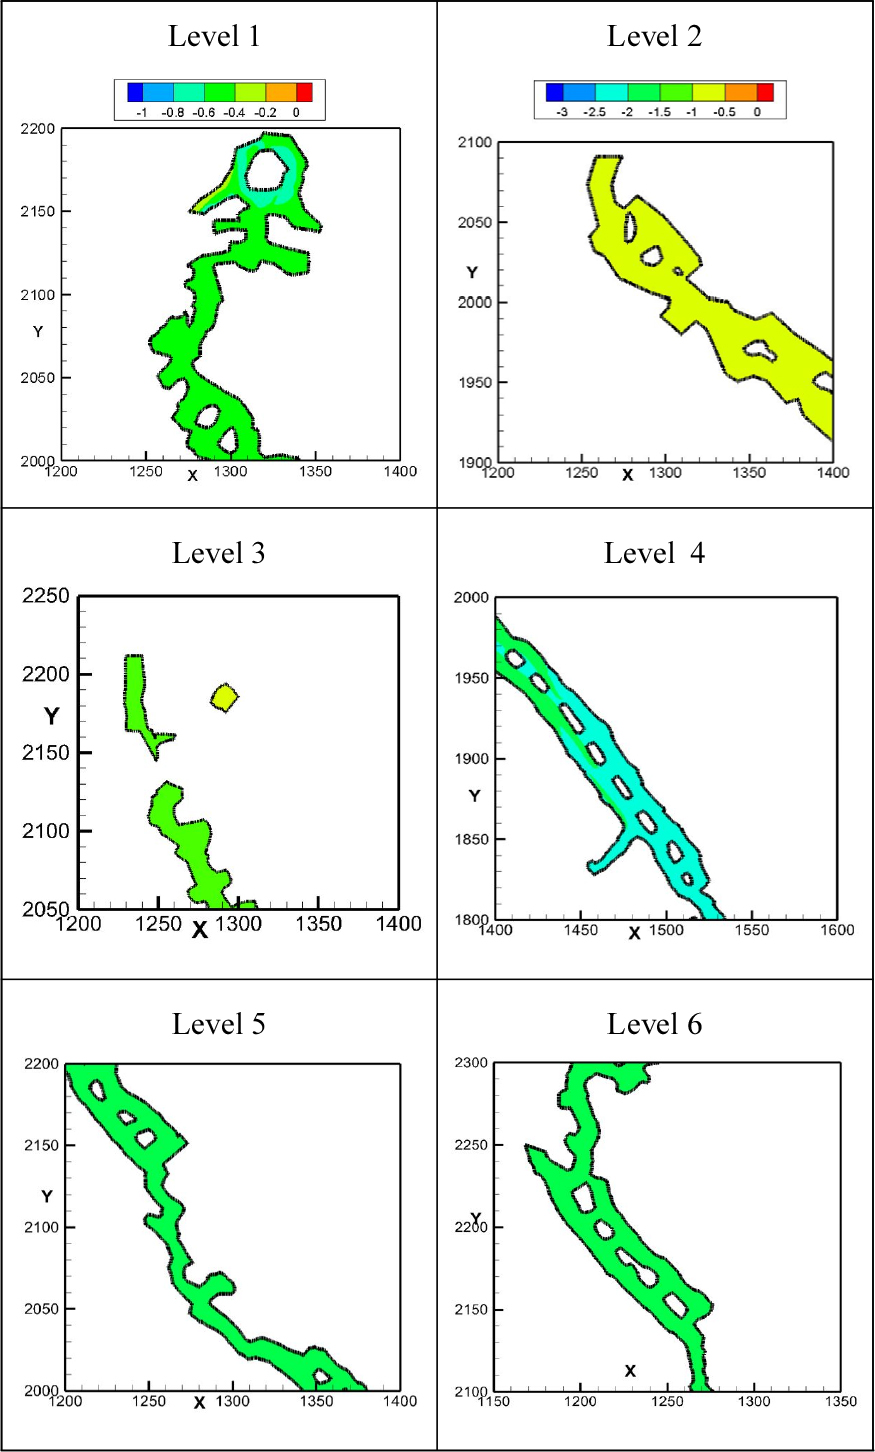
Fig. 6 presents the distribution of total pressure at computed planes for all six levels (1–6). Levels 2-6 share identical contour values, while only level 1 has different values.The values of total pressure (Pa) are all negative because the static pressures are negative. The main fan exhausts the dirty air in the entire mine to the outside. The air velocity is too small to affect the total pressures. However, the pressures at Levels 5 and 6 show higher value than those at Levels 2 and 3. The main fan affects pressure values at Levels 5 and 6 more although its value is small.
Structural characteristics of vorticity and eddy viscosity in entire mine
Fig. 7 shows the Z-vorticity for all 6 computed planes (Levels 1–6). The unit of z-vorticity is 1/s. Z-vorticity in Level 1 shows large magnitudes around the circular pillar. The air flow entering from the inlet is circulated here and moved into Level 1. This circular pillar is the point where the tunnel of inlet meets the tunnel of Level 1. As the air velocity is higher, the vorticity has higher values. Around the rampway, the high air velocity leads to high z-vorticity in Levels 1 and 3. In Levels 2 and 6, z-vorticity has small values owing to the small air velocity. These vorticities easily change their direction even around the pillar. In the gallery of Level 4, this is connected to the ventilation shaft of outlet with a main fan. The air velocity is comparatively high. The vortices are very clear around the pillar. The blue color indicates the negative value of Z-vorticity while the red color indicates the positive value of Z-vorticity. When the air flows past the pillars shown in Level 4 (Fig. 7), the blue colors and red colors are generated after the pillars. Around the pillars, the vortices are very clear and make the flow complicated. In the gallery of Level 5, red and blue vortices are shown around the pillars. When the air passes at the small cross-section tunnel, many vortices are generated in the tunnel. However, the values of z-vorticity are minuscule when the air passes at the large cross-section area of tunnels such as Levels 6 and 2.
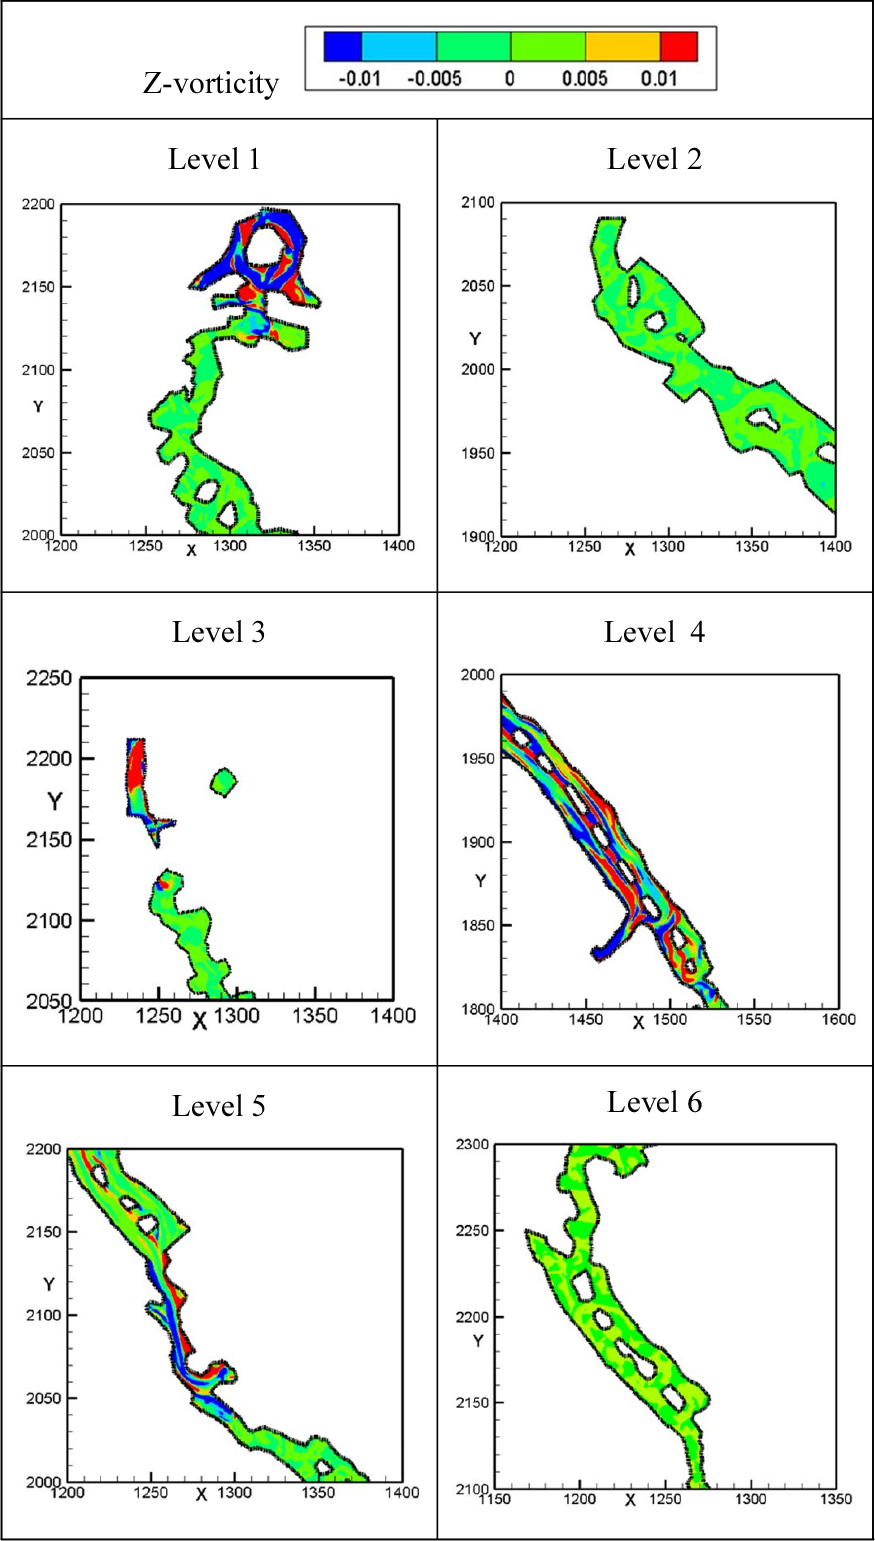
Fig. 8 shows the eddy viscosity at all computed planes (Levels 1–6).The unit of eddy viscosity is [Pa s]. The eddy viscosity values are very high where the air velocity is high. Three portions—inlet, rampway, and Level 4—have higher Eddy viscosity values. The rampways in Levels 1 and 3 have high Eddy viscosity values. These show the same trends on the gallery of Level 4. At the small cross- section area of gallery of Level 5, high eddy viscosity is clear. In the gallery wall of Level 6, eddy viscosity shows small values of the order of 10-4–10-2.
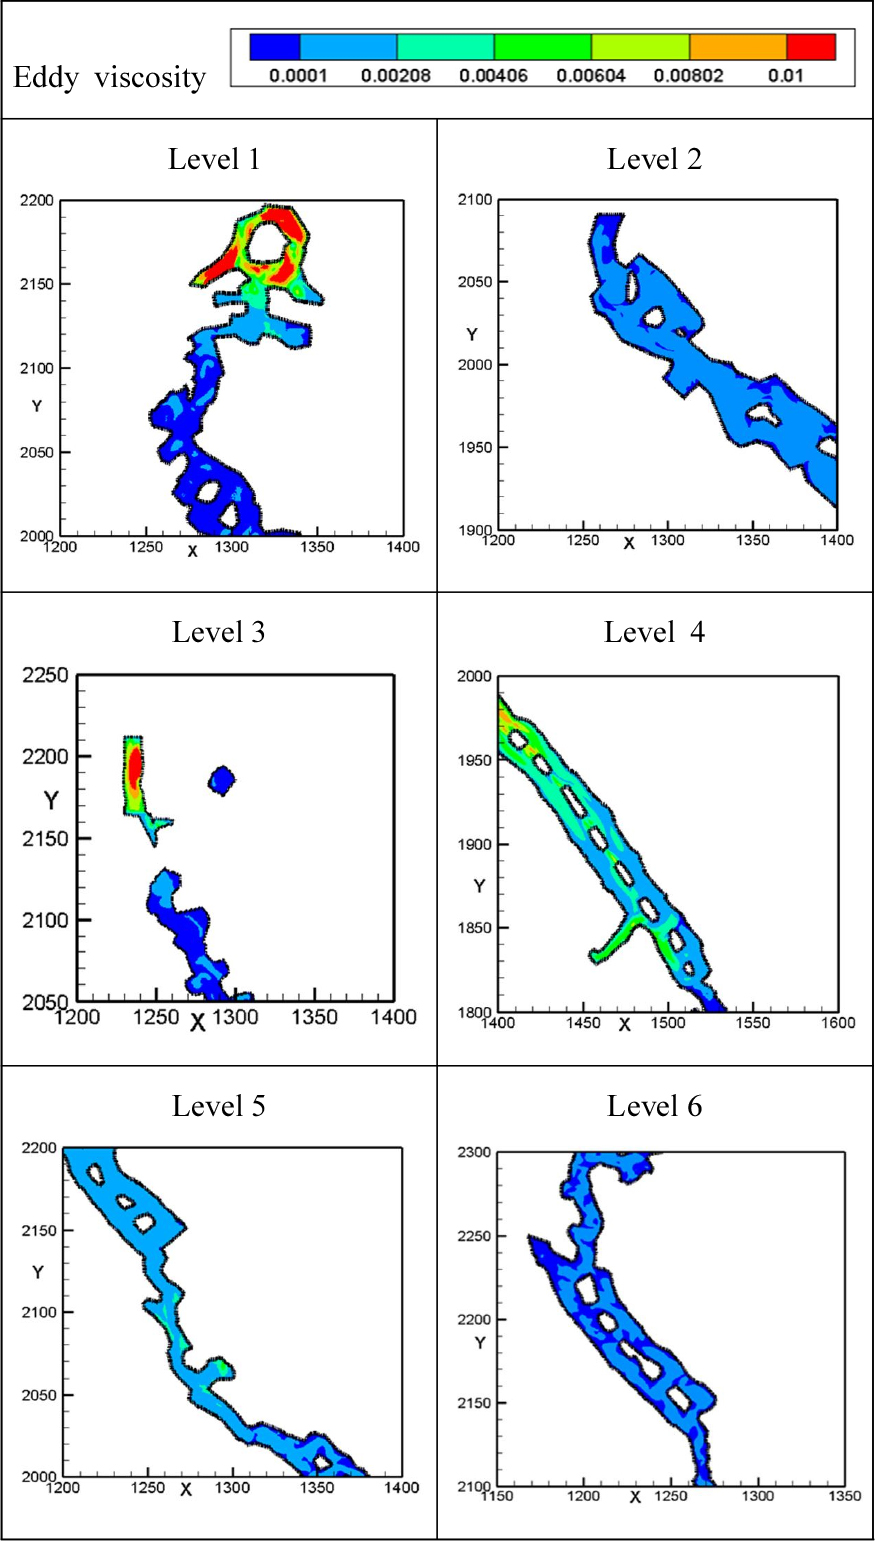
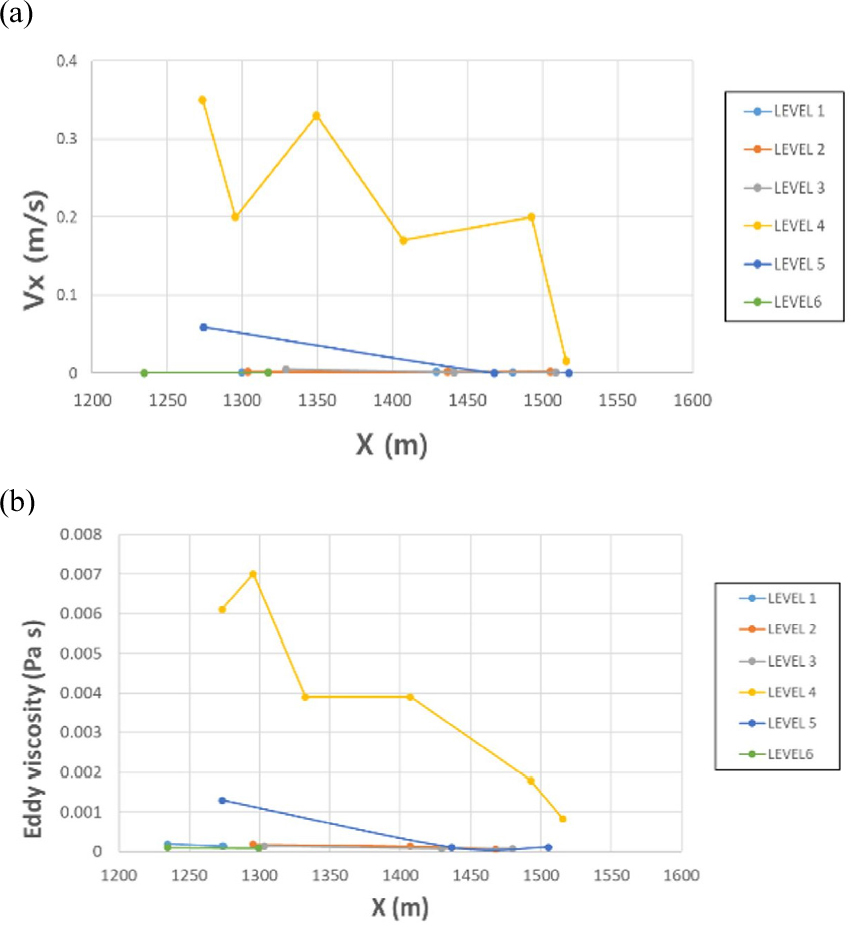
Fig. 9 presents velocities and eddy viscosities in x direction for Levels 1–6. Around X = 1300 m, all levels begin after the rampway for the connection of all levels. The air velocity in Level 4 is higher than those in the other levels because Level 4 is directly connected to the ventilation shaft. At X = 1250 m, the beginning of Level 4 is close to the rampway. The air velocity is higher near the rampway and decreases slowly toward the ventilation shaft except at X = 1350 m, where the air velocity has a high value owing to the smaller cross-section area of the tunnel. As Level 5 has a ventilation raise, the air has a small value around the raise. Except for Levels 4 and 5, the other levels show small air velocity values. The ventilation raise is effective for mine ventilation. The values of eddy diffusivity decrease along the x-direction. Turbulent air exists near the rampway, where the air velocities is higher. In the levels, the intensity of turbulence is presumed to be strong owing to the rough walls of tunnels, but the effect of rough walls is small when the air velocity is below 0.05 m/s.
Turbulent dispersion of SF6 in entire mine
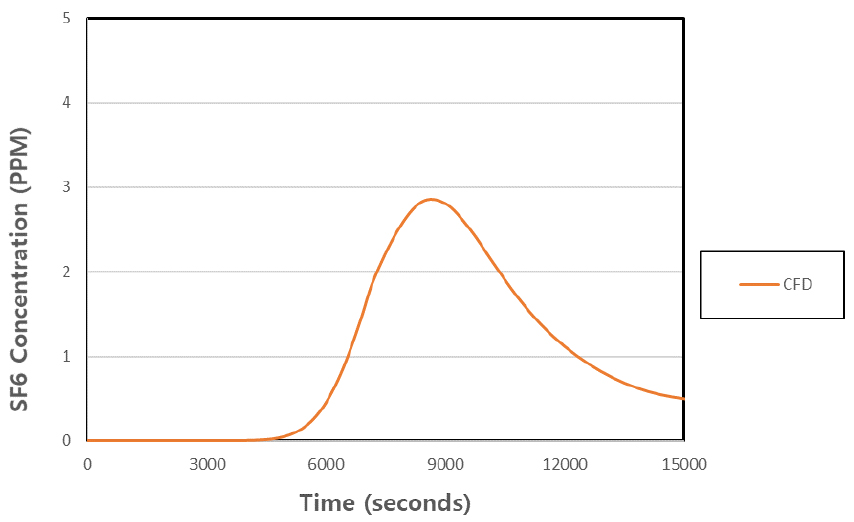
The SF6 measurement as a tracer gas is performed to analyze the gas flow behavior. The function of the SF6 tracer gas has been developed and used for mine ventilations (Thimons et al., 1974, Widodo et al., 2008, Xu et al., 2015). The details for SF6 measurement are presented by Lee et al. (2018). There are many advantages to using SF6 as a tracer gas. SF6 is easily detectable in low concentrations. Moreover, it is safe, stable, and does not exist normally in the natural environment (Laporthe et al., 2001). SF6 is released at the inlet of the mine by using balloons. SF6 measurement is undertaken at the bottom of the ventilation shaft. A total of 120 L of tracer gas is released for 30 s. The density and molar mass of SF6 are 6.14 kg/m3 and 140.06 g/mol, respectively. To obtain unsteady results, first momentum equations are solved in a steady state. Moreover, based on this result, an additional equation for SF6 dispersion is solved in an unsteady state. The calculation time is reduced, and a shorter time period can be used for this procedure compared with solving all equations in an unsteady state. Fig. 10 illustrates the numerical results depicting the diffusion of SF6. It is the time taken for SF6 gas to diffuse from the mine entrance and reach the bottom of the ventilation shaft in the tunnel of level 4. This corresponds to the median value of the concentration at the cross-section of the gallery.Therfore, these data are transient results. The findings indicate that it takes roughly 5000 seconds for the gas to travel from the inlet to the bottom of the ventilation shaft.
Summary and Conclusions
The turbulent air flow for the ventilation of an entire mine is numerically predicted in all the tunnels of the mine by using ANSYS CFX. The mine is presented as a testbed for mine ventilation. This mine has a depth and length of approximately 250 m and 1100 m, respectively. There are six levels for mining limestone, and one ventilation shaft has a main fan, which has a volumetric flow of 28.9 m3/s and pressure of 1848 Pa. In total, 15,000,000 cells are employed for the calculation, and the SST model is used for turbulence modeling. The momentum equations are solved for steady-state results, and the SF6 dispersion equation is solved for unsteady-state results.
The steady-state results present the velocity distributions, streamlines, total pressure, Z-vorticity, and eddy viscosity for all the levels. The air velocities are higher in the inlet, rampway, level 4, ventilation shaft, and outlet. Although Levels 1, 2, 3, and Level 6 are all connected to the rampway, there is no rampway effect for ventilation. Only in Level 5 does the air velocity exist because the air moves through the ventilation raise. This demonstrates that ventilation raises have a good effect on mine ventilation. Moreover, as the walls of mine tunnels are very rough, the turbulent air in tunnels can be predicted well using ANSYS CFX. The findings from the SF6 dispersion simulation illustrate the path through which the harmful gases travel from the inlet to the bottom of a shaft, showcasing their unsteady-state behavior.
The utilization of CFD in both steady-state and unsteady- state analyses of mine ventilation has shown its effectiveness in studying the intricate airflow of mines. It highlights its capacity to analyze not just the local airflow but also the ventilation of the entire mine, establishing CFD as a valuable tool in this research.
