

Introduction
Experimental
Raw Materials
Dielectric Property Measurement
Magnetic Property Measurement
Results and Discussion
Pyrite (FeS2)
Pyrrhotite (Fe1-xS)
Troilite (FeS)
Conclusions
Introduction
The coal industry is facing a challenge to be replaced by clean energy like nuclear energy, with depletion of high rank-coal and social awareness that coal combustion is the main culprit of global warming around the world. Especially, sulfur in coal has been identified as hazardous substance due to oxidation in coal combustion. Therefore, it needs to be removed before coal utilization. Most of inorganic sulfur occurs in coal with pyritic and sulfate forms, which is hard to be reduced through conventional dry separation methods without selective flocculation using polyxanthate and froth flotation (Attia et al., 1988; Lee et al., 2008).
However, researchers have found that sulfur in pyrrhotite (Fe1-xS) could be easily removed by magnetic separation due to its high magnetic susceptibility. For example, monoclinic pyrrhotite exhibits much higher apparent magnetic susceptibility than pyrite (22×106 and 0.3 ×10⁶ cgs emu per gram, respectively) (Ergun and Bean, 1968). The conversion of pyrite to pyrrhotite is thus expected to obtain an apparent increase of magnetic susceptibility, leading to higher efficiency of magnetic separation of sulfur from coal. Ergun and Bean (1968) found that conversion of only 0.5% of pyrite (FeS2) to pyrrhotite would be sufficient to produce an apparent magnetic susceptibility of 10 or more (Ergun and Bean, 1968). They also proposed that high- frequency heating of coal might achieve selective absorption by pyrite and partial conversion to pyrrhotite. Nelson et al. (1981) noticed that the dielectric loss factor of a dense pyrite bearing portion separated from coal with high sulfur content increases with microwave frequency (Nelson et al., 1981). Bluhm et al. (1986) investigated the variation of apparent magnetic susceptibility during the microwave heating. The results indicated that the susceptibility can be increased by microwave heating. Fanslow et al. (1980) found that pyrite in coal could be heated nine times faster than “clean coal” at 2.45 GHz. It indicated that the selective heating of pyrite and conversion of pyrite to pyrrhotite using microwave are possible to achieve. Weng (1993) and Weng et al. (1990) investigated the effect of heating time at specified power on the inorganic desulfurization efficiency. It was discovered that 91% inorganic sulfur could be removed by magnetic separation at 0.6 T following microwave heating with 1.5 kW at 2.45 GHz for 60 s. Uslu and Atalay (2004) studied the microwave heating of lignite for enhanced magnetic removal of pyrite. They showed that the separation efficiency was significantly increased with addition of 5 % magnetite, which is an excellent microwave absorber. Furthermore, 55.11% pyritic sulfur in coal could be reduced by magnetic separation at magnetic field of 2 T following microwave heating.
The above studies demonstrated that coal desulfurization assisted by microwave heating provides a promising solution to the problem of sulfur removal of coal. The efficiency of desulfurization relies on several parameters such as microwave frequency, power, sample mass, pyrite content, coupling agent and heating time. However, it is also noticed that all above researchers have not considered the variations of dielectric and magnetic properties of coal components during microwave heating. Since microwave heating is highly dependent on these properties, it is extremely important to determine the corresponding parameters for major sulfur minerals and other related phases in coal, especially pyrite, pyrrhotite and troilite.
Experimental
Raw Materials
The identification of phase in a sample was performed via X-Ray Diffraction (XRD). XRD patterns for the samples were obtained using a conventional Scintag XDS-2000 powder X-ray diffractometer with a graphite monochromator and Cu Kα radiation.
Pyrite (FeS2, Zacatecas, Mexico) samples were obtained from Ward’s Natural Science Establishment, Inc. USA. The composition was confirmed using X-ray Diffraction, as shown in Fig. 1(a). It is seen that there is no observable impurity in the sample.
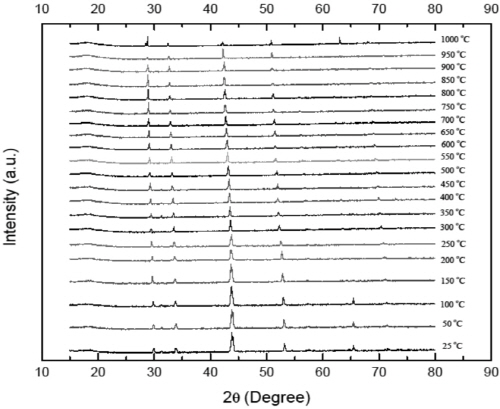
Pyrrhotite (Fe1-xS, x = 0.125, Chihuahua, Mexico) sample was obtained from OBG Gems & Minerals, Co. USA. The natural pyrrhotite sample was crushed before use and the composition was confirmed using X-ray diffraction (Fig. 1(b)). Furthermore, to evaluate the thermal stability of pyrrhotite, in situ high temperature X-ray diffraction (HT-XRD) was carried out using a PANalytical X'Pert PRO X-ray diffractometer with Cu Kα radiation.
Troilite sample (FeS, 99.9% purity) was purchased from Sigma Aldrich, Corp., USA The sample composition was identified using XRD (Fig. 1(c)).
All samples were crushed under 200 mesh before use.
Dielectric Property Measurement
Dependent upon the frequency and temperature range, the dielectric response of a substance is commonly presented as permittivity (ε), which can be given by (Peng et al., 2010)
 (1)
(1)
where εr is the complex relative permittivity, and j is the imaginary unit (j2=-1). Since the values of permittivity for most materials are quite small, the complex relative permittivity is usually used instead to describe the dielectric response. As indicated by Eq. (1), the complex relative permittivity is comprised of two components: the real part (εr′, F/m) and imaginary part (εr″, F/m). The real part is generally known as relative dielectric constant, which is a measure of the ability of the dielectrics to store electrical energy. The imaginary part is also called relative dielectric loss factor, which represents the loss of electrical energy in dielectrics, as mentioned before. For common non- magnetic inorganic substance, εr″ determines the heating rate under microwave irradiation.
In this study, to determine the dielectric properties (εr′ and εr″) of the inorganic components of coal, the cavity perturbation technique was employed for the measurements at 915 MHz and 2,450 MHz, the two frequencies available for industrial and domestic applications (Peng et al., 2011; Pickles et al., 2005). This method measures the differences (frequency shift and change of quality factors) in the microwave cavity response between a cavity with an empty sample-holder and the same cavity with a sample- holder plus the sample. These differences are then used to calculate the permittivity.
As illustrated in Fig. 2, the major components of the measurement system are a resistive heating furnace and a cylindrical TM0n0 resonant mode cavity (ø580 mm × 50 mm). To measure the permittivity at specific temperature, the top section of the holder containing sample was raised into the furnace and held at least 5 min to ensure that the sample achieves the equilibrium furnace temperature. Then the holder with hot sample was quickly (< 1.5 s for each frequency) lowered into the central, maximum electric field region of the thick-walled, well-cooled copper TM0n0 cavity, where the frequency shift  f and quality factor Q due to the sample insertion were recorded in a Hewlett Packard 8753B vector network analyzer.
|
Fig. 2. Schematic diagram of the dielectric and magnetic characterization system (Peng et al., 2011). |
With the data of the frequency shift  f and quality factor Q, the electric susceptibility (χe= χe′ - jχe″) was calculated through the following equation (Peng et al., 2010):
 (2)
(2)
where fe is the specific cavity mode frequency (915 MHz or 2450 MHz) , QL,E is the loaded cavity quality factor with the empty holder, Δf is the frequency shift produced by the sample, QL,S is the loaded cavity Q with the holder and sample, Fsh is a real number dependent only on the sample shape, Vs and Vc are the respective sample and cavity volumes, A is a real calibration constant dependent only on the shape of the electric fields in the absence of the sample. After the susceptibility was determined, the permittivity parameters include relative dielectric constant (εr′) and dielectric loss factor (εr″) were calculated.
Magnetic Property Measurement
Dependent upon the frequency and temperature range, the magnetic response of a substance in microwave heating can be presented as permeability (μ), which is given by (Peng et al., 2010):
 (3)
(3)
where μr is the complex relative permeability. Since the values of permeability for most materials are quite small, the complex relative permeability is usually used instead to describe the magnetic response. As indicated by Eq. (3), the complex relative permeability is comprised of two components: the real part (μr′) and imaginary part (μr″). The real part is generally known as relative magnetic constant, which is a measure of the ability of the magnetic dielectrics to store magnetic energy. The imaginary part is also called relative magnetic loss factor, which represents the loss of magnetic energy in the dielectrics. For common magnetic inorganic substance, μr″ significantly influences the heating rate under microwave irradiation.
In order to evaluate the magnetic loss in microwave heating of coals, the permeability measurements for some inorganic phases in the coal samples were performed.
The complex permeability was measured using a ridge- loaded-WR284 waveguide-based resonant cavity which produces a region of maximum magnetic field strength at the shorted end of the waveguide. The sample was moved rapidly into this maximum field, and again the frequency shift and change in loaded Q are measured. The complex permeability is calculated using a formula identical in form to Eq. (2), but with the appropriate frequency and Q and shape factors and calibration constants for the magnetic cavity.
The permeability measurements are, in practice, less accurate than permittivity measurements because large corrections have to be made for the frequency and Q shift in the magnetic cavity that are caused by the small, but significant, electric field that exists in the high magnetic field region. Since the complex dielectric constant is almost always much larger (typically 10 times) than the complex permeability, the small electric field causes frequency shifts and Q changes that must be taken into account. Thus the magnetic measurements require subtractions that depend upon reliable values at each temperature of the complex permittivity. Only after these corrections have been made, can the complex magnetic susceptibility χm, be determined by using the following equation:
 (4)
(4)
where fm is the cavity mode frequency in permeability test, and the  f and Q are only from the magnetic field induced contribution. Even after these corrections, other problems exist in the interpretation of the apparent measured magnetic susceptibility. If the sample has a moderately large high- frequency electrical conductivity (which is determined by the permittivity measurements), the time-varying microwave magnetic field can induce electrical fields in the sample that produce azimuthal induced currents in the sample, completely analogous to low frequency induction heating. This represents another mechanism of power loss in the sample, and produces power loss and a reduction in Q. However, these losses are mainly due to the electrical conductivity of the sample, which is part of the imaginary permittivity. These “induced electric field” losses are not significant in the permittivity measurements because of the very low magnetic field in the central region of the TM0n0 cavity, relative to the electric field.
Another problem occurs if the sample conductivity is very high, as with an almost metallic sample. If the conductivity is such that the skin depth is small relative to the diameter of the sample, this implies that the induced currents produce a “bucking” magnetic field in the sample interior that exactly counters the cavity magnetic field. In this way, all magnetic fields are excluded from the interior of the sample. This is the typical Lenz Law situation, and implies an “apparent” magnetic susceptibility,  = ‒1, or a value mr = 0 if interpreted incorrectly using Eq. (4). These problems can only be avoided by a detailed knowledge of the physical and solid state properties of the sample at all temperatures.
During each permittivity and permeability measurement, the sample powders were first uniaxially pressed at about 200 MPa in a die lined with tungsten carbide to form 3 pellets with a diameter of about 3.5 mm and a total, stacked length (height) of about 12 mm. They were subsequently step-heated to the designated temperatures, all done in 0.01 l/min flowing UHP argon. The whole measurement sequence was pre-programmed and temperature calibration in the furnace, movement of the linear actuator (Fig. 2), and network analyzer analysis were all controlled by a PC running Labview control software.
Results and Discussion
Microwaves are electromagnetic waves having frequency range of which is from 0.3 to 300 GHz (corresponding to wavelengths, λ, from 1 mm to 1 m). Microwave energy dissipates instantaneously throughout the volume of the material and heats it directly, resulting in much higher heating efficiency than conventional heating methods (Hotta et al., 2011).
Quantitatively, microwave absorption (Q, W/m3) by material can be described by the following equation:
 (5)
(5)
where ω is the microwave angular frequency, ε0 is the permittivity of free space (8.854×10⁻¹² F/m), εr″ is the imaginary part of complex relative permittivity (also known as relative dielectric loss factor) of material,  is the microwave electric field amplitude in material, μ0 is the permeability of free space (4p×10-7 H/m), μr″ is the imaginary part of complex relative permeability (also known as relative magnetic loss factor) of material, and
  is the microwave magnetic field amplitude in material.
As indicated by Eq. (5), microwave heating depends on the dielectric (permittivity) and magnetic (permeability) properties of material. For microwave heating of coal, most organic fraction of coal presents low dielectric loss and is essentially transparent to microwaves at room temperature. Inorganic components of coal such as water and pyrite, however, have been identified as good microwave absorbers (Fanslow et al., 1980). Consequently, to seek the optimal conditions regarding the microwave coal desulfurization and drying, it is essential to characterize the dielectric and magnetic properties of main inorganic components of coal.
During the desulfurization process, the following reactions may occur:
 (6)
(6)
The first step is known as decomposition reaction of pyrite (FeS2), leading to formation of pyrrhotite (Fe1-xS). The pyrrhotite may further decompose to troilite (FeS, less stable) and then oxidize to magnetite (Fe3O4) and hematite (Fe2O3) in air. Due to these phase transformations, the dielectric and magnetic properties of these phases need to be determined.
Pyrite (FeS2)
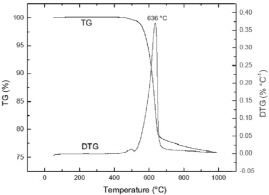
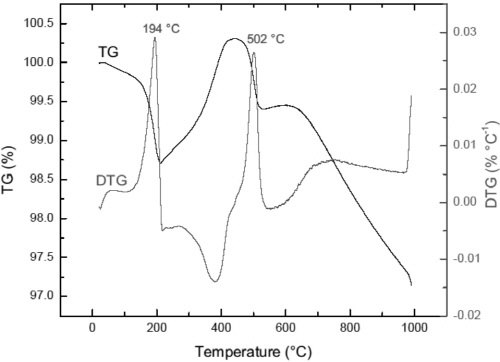
Fig. 3 presents the results of thermogravimetric analyses of pyrite sample, which were performed using a TA Instruments Q50 Thermogravimetric Analyzer with heating rate of 5 degree/min in a stream of nitrogen at a flow rate of 100 ml/min. The TG/DTG curves in the figure indicate the sample still consists of pyrite phase at 500°C. Pyrite decomposition does not start below 500°C and higher temperature leads to apparent weight loss between 500 and 650°C. This is caused by the transformation of pyrite to pyrrhotite, as shown by the following reaction (Toulmin and Barton, 1964):
 (7)
(7)
This transformation is found to be an endothermic reaction. It suggests that it is necessary to heat pyrite to at least 500°C to fully transform pyrite to magnetic pyrrhotite. This result agrees with the phenomenon observed by Bhargava et al. in 2009.
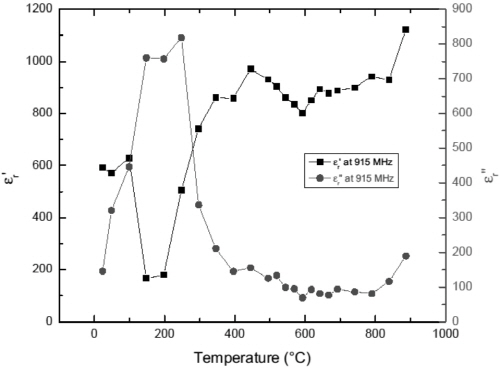
Fig. 4 shows the permittivity of pyrite at frequency of 915 MHz. The high dielectric loss factor at room temperature indicates that pyrite can be heated effectively using microwaves. The relative dielectric constant and relative dielectric loss factor slightly increase with temperature up to about 450°C. Then both parameters show peaks locating at around 500°C. This is related to the phase transformation of pyrite. The rapid drop of permittivity of pyrite is probably ascribed to the formation of pyrrhotite. Continuous heating to 750°C results in dramatic increase of dielectric constant due to the thermal excitation of pyrite atoms. The relatively constant permittivity above 800°C is assumed to be caused by the sintering effect.
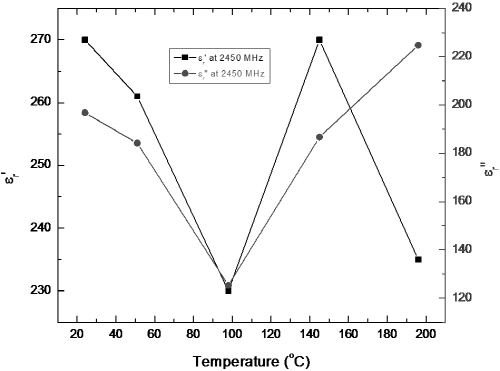
Fig. 5 shows the temperature dependency of permittivity of FeS2 at 2450 MHz. The most significant feature in the figure is that at 2450 MHz, pyrite samples exhibit sharper increases of the dielectric constant and loss factor when the temperature is increased to about 700°C. This difference stems from the stronger friction between sample atoms at higher frequency.
As can be seen from Fig. 4 and 5, pyrite presents large dielectric losses at the given microwave frequencies. This observation is in agreement with the experimental finding in which pyrite in coal could be heated nine times faster than “clean coal” at 2.45 GHz (Fanslow et al., 1980).
The variations of permeability of FeS2 with temperature below 500°C at 915 and 2450 MHz are shown in Fig. 6 and Fig. 7, respectively. It is presented that the relative magnetic loss factors of FeS2 at both frequencies are between 0.2 and 0.4 in this temperature range. This suggests that although pyrite is not a strong magnetic substance, it still contributes to the magnetic loss in microwave heating of the coals. In other words, compared to organic phases of coals, pyrite presents better microwave absorption property. Since FeS2 has high dielectric loss factor even at room temperature, as discussed above, it can be considered as a microwave absorber in microwave heating of coal due to its dielectric loss and magnetic loss. Also, note that the decrease of the relative magnetic constant is caused by the increase of electrical conductivity of sample, as indicated by the variation of permittivity with temperature before.
Pyrrhotite (Fe1-xS)
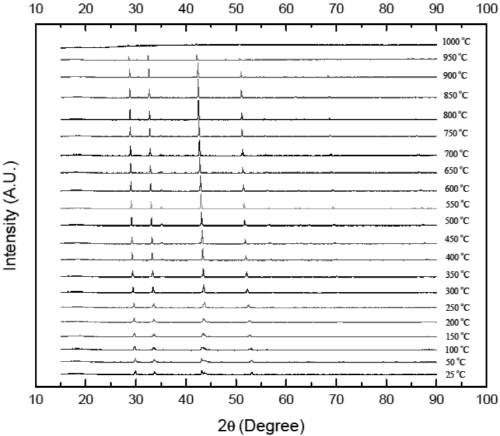
Fig. 8 shows the HT-XRD patterns of pyrrhotite sample at temperature ranging from 25 to 1000°C. It is identified that no obvious phase transformation was observed below 1000°C. However, it should be emphasized that the peaks of XRD patterns shift to lower angles and show weak intensity at high temperatures. The shift is believed to be largely a consequence of thermal expansion of lattice planes, followed by increase of the inter-planar distance (d). It can be illustrated by Bragg’s law (Liu et al., 2008; Okolo et al., 2004):
 (8)
(8)
where n is an integer determined by the order given, λ is the wavelength, and θ is the scattering angle. The decrease of peak intensity is caused by the Debye temperature effect on the X-ray diffraction. Since the melting point of pyrrhotite is lower than 1188°C (depending on non- stoichiometry), this effect becomes strong at temperature above 800°C (Jensen, 1942).
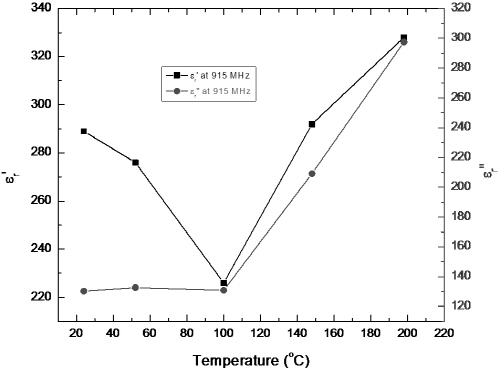
Fig. 9 and 10 present the temperature dependences of permittivity of Fe1-xS at 915 MHz and 2450 MHz, respectively. The large dielectric constant and loss factor of Fe1-xS at temperatures below 200°C suggest that this phase has good microwave absorption capability at microwave frequency. This result is in agreement with the experimental observation.
Troilite (FeS)
Fig. 11 shows the HT-XRD patterns of troilite sample. The split peak corresponding to (114) lattice plane in Fig. 2 (c) indicates that the sample may contain little pyrrhotite. This is mainly due to the chemical similarity between these two phases. From the HT-XRD patterns in Fig. 11, it is seen that there is a small phase transformation in the temperature range of 100 to 300°C. This can be assigned to the conversion of pyrrhotite to FeS. At high temperatures, such as 1000°C, only pretty weak X-ray diffraction signals could be detected as a consequence of breakdown of crystal structure during the melting of FeS.
To identify the thermal stability of FeS, thermogravimetric analyses of the sample was performed. TG/DTG curves in Fig. 12 indicate that a slight mass loss occurs between 100 and 300°C. This result is almost coincident with that of HT-XRD. Also, it is found that the sample gradually loses weight above 600°C. This indicates the thermal instability of iron sulfide at high temperatures although the specific reaction mechanism has not been clarified yet.
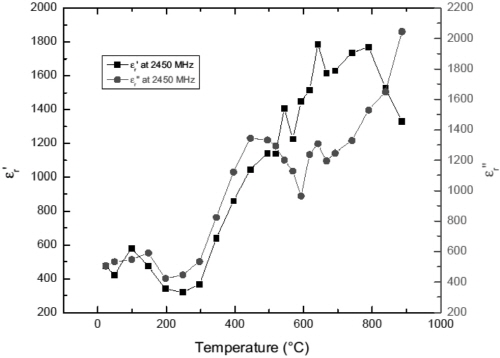
Fig. 13 and 14 show the temperature dependences of permittivity of FeS at 915 MHz and 2,450 MHz, respectively. The dielectric constant and loss factor of FeS are found to be highly temperature and frequency dependent. It is also noticed that the values at 915 MHz vary abruptly between 100°C and 300°C. This is probably due to the phase transformation of iron sulfide, as discussed above. Furthermore, the data in both figures indicates that FeS exhibits high dielectric loss even at room temperature. It is thus reasonable to assume that troilite can be efficiently heated by microwaves although this phase is extremely rarely encountered in the Earth's crust.
Conclusions
The microwave heating is a good solution to the problem of iron sulfide minerals removal of coal. However, most of researchers have not considered the variations of dielectric and magnetic properties of coal components during microwave heating. In this study, we focussed on a transformation properties of iron sulfide including pyrite, pyrrhotite, and troilite by microwave heation.
Microwave dielectric measurements suggest that iron sulfides have good microwave absorption capabilities. The magnetic measurements show that pyrite exhibits magnetic loss in microwave heating. Hematite does not present noticeable magnetic response below 1000°C and magnetite possesses strong magnetism at room temperature and then gradually loses it with increasing temperature due to “Curie point” effect.
Pyrite decomposes to pyrrhotite or troilite at temperature above 500°C in non-oxygen/low pressure atmosphere. Pyrrhotite or troilite in vacuum remain relatively stable in the temperature range of 24-1,000°C. Oxidation of pyrite produces magnetite and hematite. The formation of magnetite could enhance the efficiency of magnetic separation of sulfur-containing coal. Excessive formation of hematite may cause energy loss and low microwave heating effectiveness.
