

서 론
광업 및 건설 현장에서 발파 작업으로 인해 발생하는 대기소음(air overpressure), 발파진동, 비석은 인근 지역주민과 환경에 피해를 줄 수 있다(Khandelwal and Singh, 2005; Monjezi et al., 2011; Rezaei et al., 2011; Roy et al., 2011; Armaghani et al., 2015a; Ebrahimi et al., 2016). 특히, 발파 충격파에 의한 급격한 기압 변화로 발생하는 대기소음은 사람의 청각, 폐, 뇌 및 기타 장기에 손상을 유발할 수 있으며, 주변 건물의 유리창을 파손하는 등 재산피해를 줄 수 있다(Khandelwal and Kankar, 2011; Mohamad et al., 2016). 따라서 발파시 발생할 수 있는 대기소음의 크기를 발파설계 단계에서 예측하여 피해방지 대책을 수립하는 것이 중요하다.
그동안 발파시 발생하는 대기소음의 크기를 예측하는 기법에 관한 연구가 다수 수행되었다(Siskind et al., 1980; Hustrulid, 1999; Kuzu et al., 2009; Hajihassani et al., 2014). 기존의 연구들은 지발당 최대장약량과 이격거리를 고려하여 대기소음을 예측할 수 있는 경험식을 다음과 같이 제시하였다.
여기서 AOp는 대기소음(dB(A)), D는 발파원으로부터의 이격거리(m), W는 지발당 최대장약량(kg/delay)이다. b는 자승근 환산거리(Square Root Scaled Distance, SRSD)를 적용시 1/2, 삼승근 환산거리(Cube Root Scaled Distance, CRSD)를 적용시에는 1/3이다. H와 β는 암반 및 발파 조건에 따르는 상수를 의미한다(Table 1). 그러나 많은 연구에서 경험식을 이용한 대기소음 예측은 정확도가 높지 않다고 보고하였다(Khandelwal and Singh, 2005; Khandelwal and Kankar, 2011; Armaghani et al., 2015a; Armaghani et al., 2016; Hasanipanah et al., 2016; Hasanipanah et al., 2017; Armaghani et al., 2018).
Table 1.
Values of H and β used in the empirical formula for air overpressure prediction in previous studies
| Reference | Rock and blasting conditions | H | β |
| Siskind et al. 1980 | Quarry blasts, behind face | 622 | 0.515 |
| Quarry blasts, direction of initiation | 19,010 | 1.12 | |
| Quarry blasts, front of face | 22,182 | 0.966 | |
| Hustrulid, 1999 | Detonations in air | 185,000 | 1.2 |
| Kuzu et al. 2009 | Quarry blasts in competent rocks | 261.54 | 0.706 |
| Quarry blasts in weak rocks | 1833.8 | 0.981 | |
| Overburden removal | 21,014 | 1.404 | |
| Hajihassani et al. 2014 | Quarry blasts, front of face (distance of 300 m) | 10,909 | 1.09 |
| Quarry blasts, front of face (distance of 600 m) | 959.48 | 0.45 |
이러한 한계를 극복하기 위해 최근에는 머신러닝 모델을 이용한 대기소음 예측에 관한 연구가 활발히 진행되고 있다. Khandelwal and Singh(2005)는 마그네사이트 광산에서 수집된 56개의 발파 데이터를 이용하여 대기소음의 크기를 예측할 수 있는 인공신경망(artificial neural network, ANN) 모델을 개발하였다. Armaghani et al.(2015b)는 노천광산에서 128개의 발파 데이터를 획득하여 다섯 개의 입력변수(지발당 최대장약량, 비장약량, 저항선, 전색장, 이격거리)와 한 개의 출력변수(대기소음)로 구성된 ANFIS (adaptive neuro-fuzzy inference system)을 개발하였다. 그 밖에도 발파로 인한 대기소음을 예측하기 위한 머신러닝 모델 개발에 관한 연구가 다수 수행되었다(Armaghani et al., 2016; Hasanipanah et al., 2017; Nguyen and Bui, 2019; Nguyen et al., 2020). Table 2는 대기소음 예측용 머신러닝 모델 개발 관련하여 기존 연구들이 수행된 지역(국가), 사용된 데이터의 수, 고려한 인자들의 종류를 보여준다. 그러나 해외 연구동향과는 달리 국내에서는 대기소음 예측을 위한 머신러닝 모델 개발에 관한 연구가 미흡한 실정이다.
Table 2.
Study area, the number of data and features considered in previous studies for predicting air overpressure using machine learning models
| Reference | Khandelwal and Singh, 2005 | Armaghani et al., 2015b | Armaghani et al., 2016 | Hasanipanah et al., 2016 | Hasanipanah et al., 2017 | Nguyen and Bui, 2019 | Nguyen et al., 2020 | |
|
Study area (country) |
Mirzapur and Pitoragarh (India) |
Kulai, Senai and Kota Tinggi (Malaysia) |
Rafsanjan (Iran) |
Kerman Province (Iran) |
Kerman Province (Iran) |
Ha Long (Vietnam) |
Hanoi (Vietnam) | |
| Number of data | 56 | 128 | 70 | 77 | 83 | 114 | 146 | |
| Feature |
Maximum charge per delay | ◦ | ◦ | ◦ | ◦ | ◦ | ◦ | ◦ |
|
Monitoring distance | ◦ | ◦ | ◦ | ◦ | ◦ | ◦ | ◦ | |
| Burden | ◦ | ◦ | ◦ | |||||
| Spacing | ◦ | ◦ | ||||||
|
Powder factor | ◦ | ◦ | ◦ | |||||
|
Bench height | ◦ | |||||||
| Stemming | ◦ | ◦ | ◦ | |||||
|
Number of holes | ◦ | |||||||
|
Vertical distance | ◦ | |||||||
|
Air humidity | ◦ | |||||||
본 연구에서는 국내 노천 채석장에서 2012년 9월부터 2018년 8월까지 수집된 924개의 발파 모니터링 데이터를 이용하여 발파시 발생하는 대기소음을 예측할 수 있는 머신러닝 모델을 개발하였다. 천공장, 저항선, 공간격, 지발당 최대장약량, 비장약량, 총공수, 장약된 화약 중 에멀전폭약의 비율, 이격거리를 모델의 입력인자로 사용하였고, 4종의 머신러닝 알고리즘 즉, kNN(k-nearest neighbors), RF(random forest), XGBoost(extreme gradient boosting), DNN(deep neural network)을 이용하여 모델을 훈련하였다. 훈련된 4종의 머신러닝 모델의 대기소음 예측 성능을 비교하여 연구지역에서 사용될 수 있는 최적의 머신러닝 모델을 제안하였다.
연구방법
연구지역 및 데이터
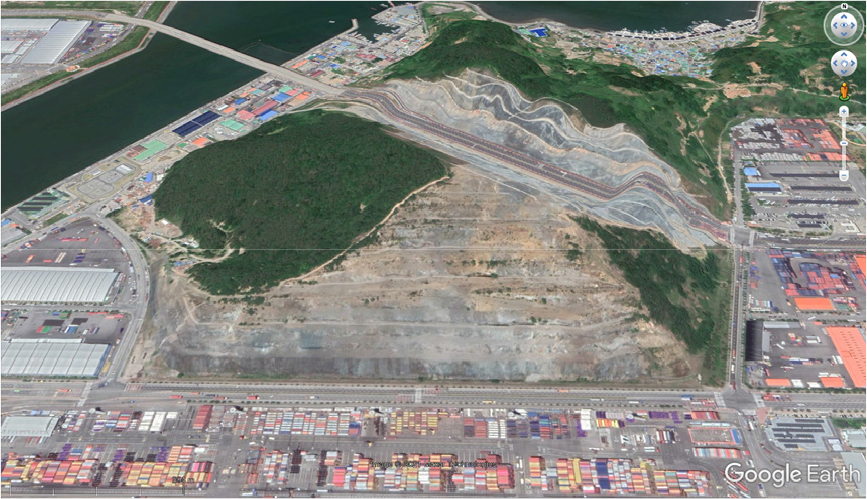
본 연구에서는 경상남도 창원시에 있는 욕망산의 노천 채석장(35°05'12"N, 128°47'24"E)을 연구지역으로 선정하였다(Fig. 1). 욕망산 정상의 해발고도는 약 200m이며, 지형 경사는 20~40° 정도이다. 연구지역의 산지와 능선 쪽에는 안산암과 유문암이 주로 분포하며, 해안 쪽에서는 산상으로 분포한 화강암을 볼 수 있다(Lee et al., 2001). 연구지역에 관한 추가적인 설명은 Jung and Choi(2021)에 제시되어 있다. 연구지역에서는 2012년 9월부터 2018년 8월까지 총 4,612회의 발파가 시행되었고, 발파가 시행될 때 이격거리에 따른 대기소음 측정 결과를 기록하였다.
본 연구에서는 연구지역에서 시행된 과거 발파 기록을 정리하여 머신러닝 모델 개발을 위한 데이터 세트를 제작하였다. 제작된 데이터 세트는 8개의 입력변수와 1개의 출력변수로 구성된다. 8개의 입력변수는 천공장, 저항선, 공간격, 지발당 최대장약량, 비장약량, 총공수, 에멀전폭약 비율, 이격거리이다. 여기서 에멀전폭약비율은 에멀전과 안포(ANFO)를 혼합한 화약에서 에멀전이 차지하는 비율을 의미한다. 출력변수로는 대기소음 측정값을 사용하였다.
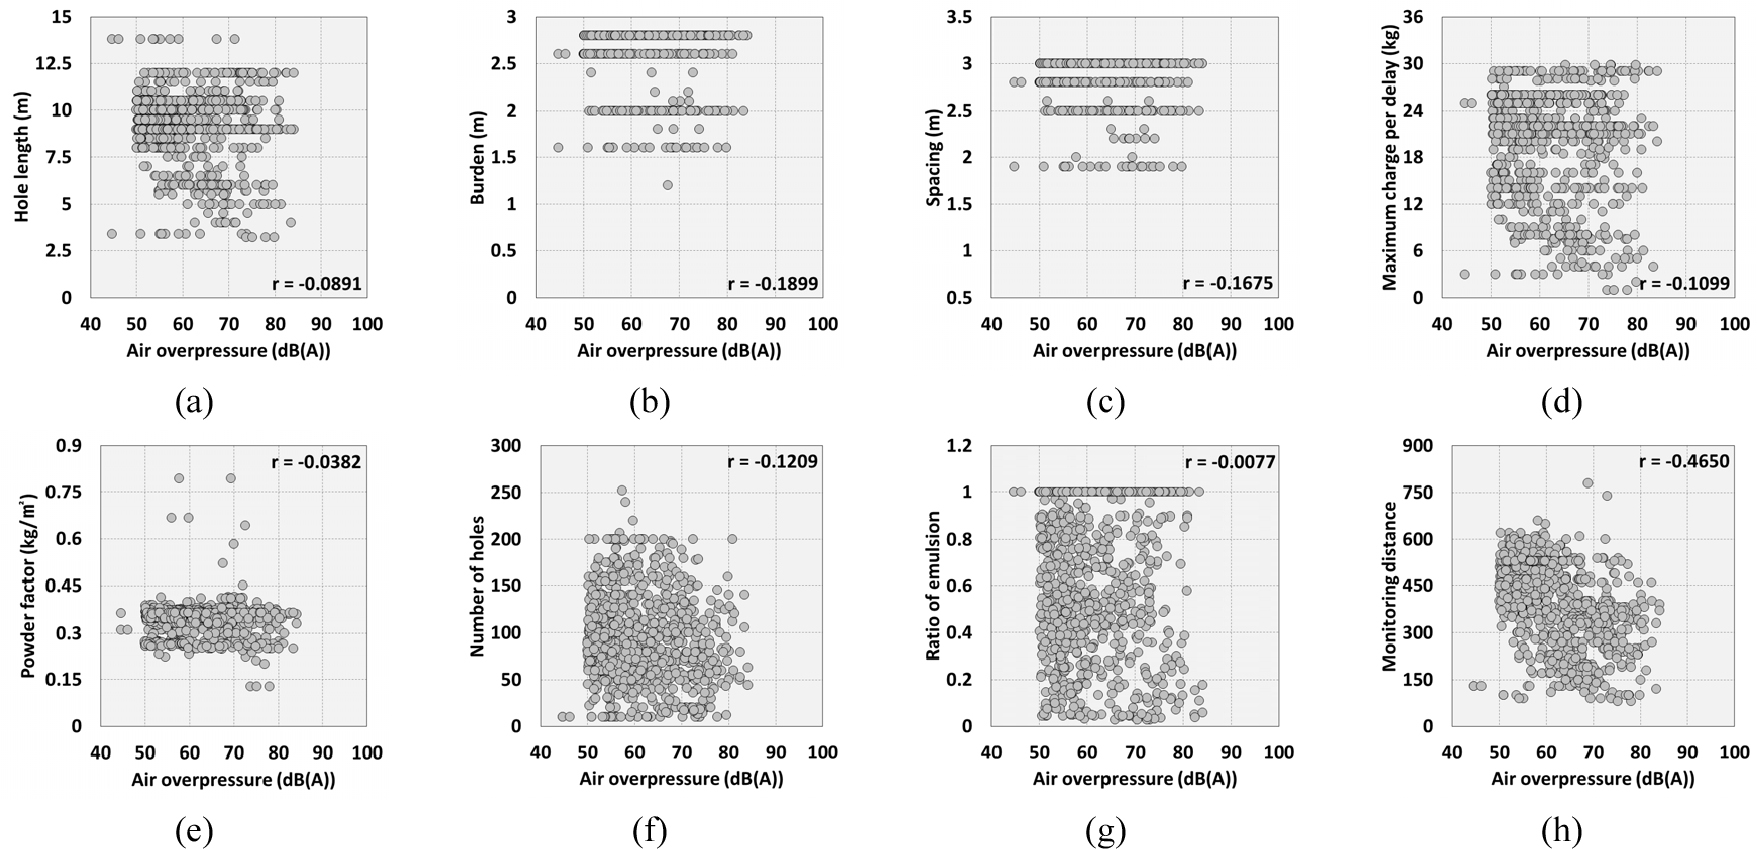
연구지역의 발파 기록 중 값이 누락되거나 이상치를 보이는 것을 제외하면 머신러닝 모델 개발에 활용 가능한 유효 데이터 수는 총 924개였다. Table 3은 유효 데이터의 입력변수와 출력변수에 대한 통계적 특성을 보여주며, Fig. 2는 대기소음과 각 입력변수 간의 상관성과 Pearson 상관계수(r)를 보여준다. 대기소음과 각각의 입력변수는 개별적으로는 상관관계가 없거나 약한 음의 상관관계를 보였다.
Table 3.
Basic statistics of data sets used for developing machine learning models
본 연구에서는 유효 데이터 924개 중 80%(739개)를 학습데이터 세트로 사용하였고, 나머지 20%(185개)를 테스트 데이터 세트로 사용하였다.
머신러닝 알고리즘
본 연구에서는 kNN, RF, XGBoost, DNN 알고리즘을 사용하여 대기소음 예측을 위한 머신러닝 모델을 훈련하였다. kNN 모델은 머신러닝에 사용되는 간단한 지도학습 모델이다(Quiros et al., 2017). 훈련 데이터에서 k개의 표본을 선택한 후 가장 가까운 이웃(neighbors)을 기준으로 예측을 수행한다. 따라서 가장 가까운 이웃을 결정하는데 사용되는 거리에 따라 예측 정확도가 달라진다(Pandya et al., 2013). kNN은 훈련 데이터를 미리 학습하지 않고 그대로 가지고 있다가 작업 요청이 있을 때 학습을 수행하기 때문에 게으른 학습(lazy learning) 모델이라고도 한다(Elevado et al., 2018).
RF 알고리즘은 무작위로 생성된 수많은 결정 트리(decision tree)들을 숲과 같은 하나의 형태로 만들어 학습을 수행한다. 하나의 트리의 학습 결과가 좋다면 많은 수의 트리는 더 좋을 것이며, 다양함을 표현하기에 적합할 것이라고 가정한다. RF는 결정 트리에서의 수직 경계들을 합하여 더 유연한 경계를 생성할 수 있다는 장점이 있다(Yoon et al., 2018). 마찬가지로 XGBoost도 수 많은 결정 트리들을 병렬처리하여 학습을 수행하는 알고리즘이다. 병렬처리를 통해 신속하게 머신러닝 모델을 훈련할 수 있으며 앞선 결정 트리의 오류를 고려하여 가중치를 계산함으로써 연속적인 학습이 가능하다는 장점이 있다(Zhou et al., 2016).
DNN은 인간의 신경망 구조에서 영감을 받아 인간 두뇌와 유사한 형태로 정보를 처리하는 인공신경망에 바탕을 둔 알고리즘이다. 입력된 데이터는 입력층, 출력층, 다수의 은닉층의 계층 구조를 가지는 많은 수의 신경층을 통해 특징 추출 과정을 거쳐 학습을 수행한다. 은닉층과 노드의 수를 다양하게 조절함으로써 최적의 딥러닝 모델을 찾을 수 있다(Yoon et al., 2018).
교차검증 및 매개변수 최적화
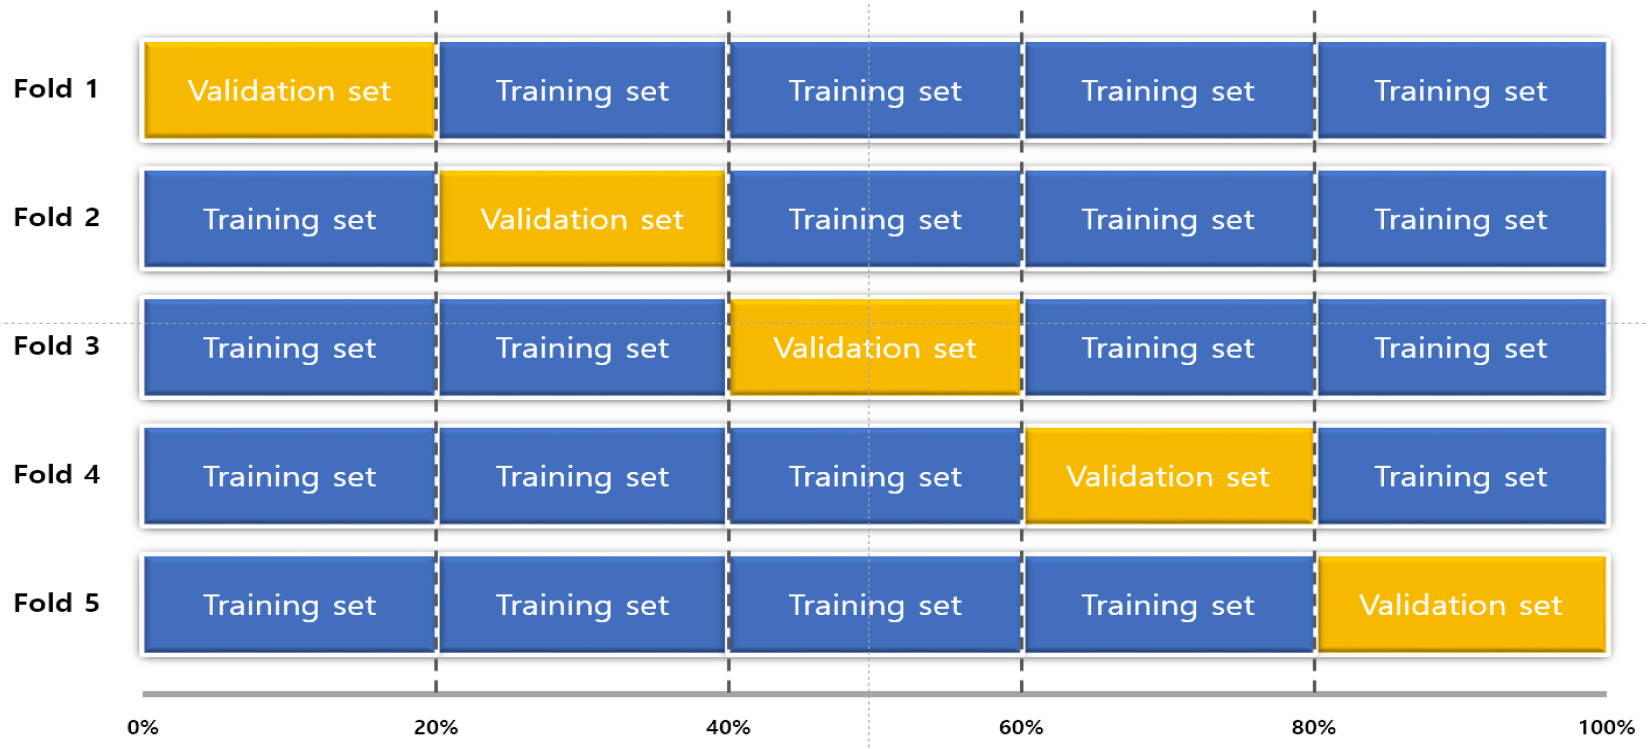
본 연구에서는 머신러닝 모델의 훈련 과정에서 학습데이터 세트를 이용한 5겹 교차검증(5-fold cross validation)을 수행하였다. 학습데이터 세트를 다섯 세트로 나누어 이 중 네 개로는 머신러닝 모델을 훈련하고, 나머지 한 개를 검증 데이터 세트로 사용하여 훈련과 검증을 반복적으로 수행하였다(Fig. 3). 이러한 5겹 교차검증을 통해 학습데이터 세트의 데이터를 모두 검증 데이터 세트로 사용할 수 있었다.
머신러닝 모델을 개발하기 위해서는 머신러닝 알고리즘에 포함된 다양한 매개변수들의 설정을 최적화할 필요가 있다(Park et al., 2021). 본 연구에서는 Table 4와 같이 알고리즘별로 매개변수의 값을 변화시키면서 반복적으로 머신러닝 모델 훈련을 수행한 후 최적의 매개변수 값을 선정하였다.
Table 4.
Values used for parameter tuning in machine learning algorithms
| kNN | RF | XGBoost | DNN | |
| Parameter | neighbors | depth & estimators | depth & estimators | hidden layer / nodes |
| Min | 1 | 100 | 100 | 1 / 20 |
| Max | 300 | 500 | 500 | 5 / 60 |
| Step | (+) 1 | (+) 50 | (+) 50 | (+) 1 / 10 |
성능평가
본 연구에서는 회귀 문제에서 성능평가 지표로 일반적으로 사용되는 MAE(mean absolute error), MSE(mean squared error), RMSE(root mean squared error)를 이용하여 머신러닝 모델을 평가하였다. 식(2), (3), (4)는 각각 MAE, MSE, RMSE의 계산식이다. 여기서 n은 전체 샘플의 수, 는 번째 샘플의 예측값, 는 번째 샘플의 실측값을 의미한다.
연구결과
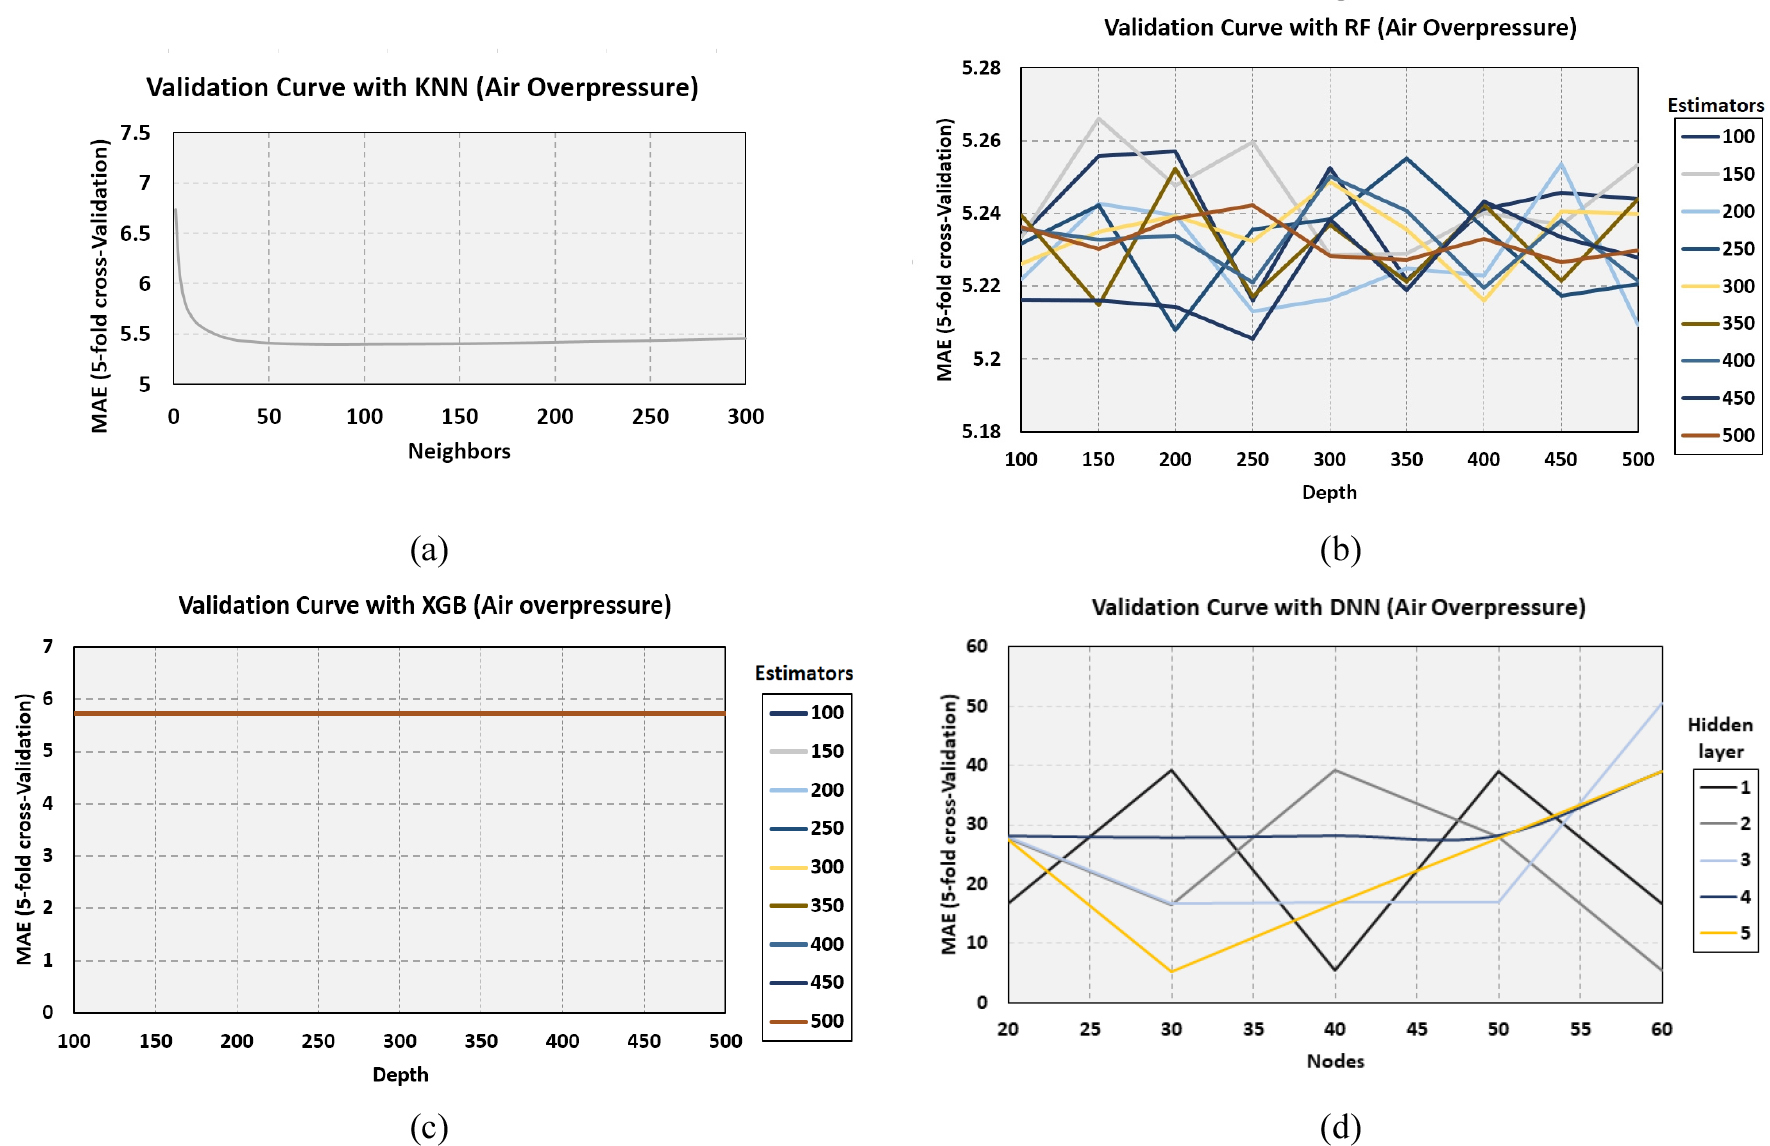
본 연구에서는 4종류의 머신러닝 알고리즘에 의한 예측 결과를 비교하여, 연구지역에서 발파 작업시 대기소음을 예측하는데 사용할 머신러닝 모델을 선정하였다. 5겹 교차검증을 통해 머신러닝 알고리즘별로 매개변수를 최적화하였다(Fig. 4). kNN 모델의 경우 neighbors가 1부터 87까지 증가할 때 MAE가 감소하다가 87 이후부터는 MAE가 다시 증가하는 것을 볼 수 있다. 따라서 kNN 모델은 neighbors를 87로 설정할 때 MAE가 5.398로 최적의 성능을 보임을 알 수 있다. RF 모델의 경우 매개변수들의 조합에 따라 예측 성능이 크게 달라졌다. 매개변수 조합 중 depth가 250, estimators가 450일 때, MAE가 5.206로 가장 좋은 훈련 결과를 보였다. XGBoost 모델은 모든 매개변수 조합에서 MAE가 5.732로 동일한 예측 성능을 보였다. DNN 모델의 경우 hidden layer의 수가 1, nodes의 수가 40일 때 MAE가 5.366으로 가장 우수한 예측 성능을 보였다.
5겹 교차검증을 통해 선정된 최적의 매개변수들을 머신러닝 알고리즘에 적용하여 모델을 훈련한 후 테스트 데이터 세트(전체 데이터의 20%, 185개)에 대한 모델의 예측 성능을 평가하였다. Fig. 5에서 kNN 모델의 예측값과 실측값의 데이터 분포를 보면 예측값이 약 55dB(A)과 68dB(A)에 몰려있는 것을 확인할 수 있다. 대조적으로 kNN 모델을 제외한 나머지 세 가지 모델은 예측값이 일부 값으로 집중되지 않고 편향되지 않은 것을 확인할 수 있다. 그러나 RF, XGBoost, DNN 모델도 예측값과 실측값의 상관계수(R2)가 각각 0.41, 0.34, 0.40로 분석되어 약한 상관관계를 가지는 것으로 나타났다. 즉, 실측값과 예측값을 도시한 점들의 전체적인 분포를 볼 때는 4종류의 모델 모두 예측값과 실측값 간의 높은 상관관계를 보이지는 않았다.
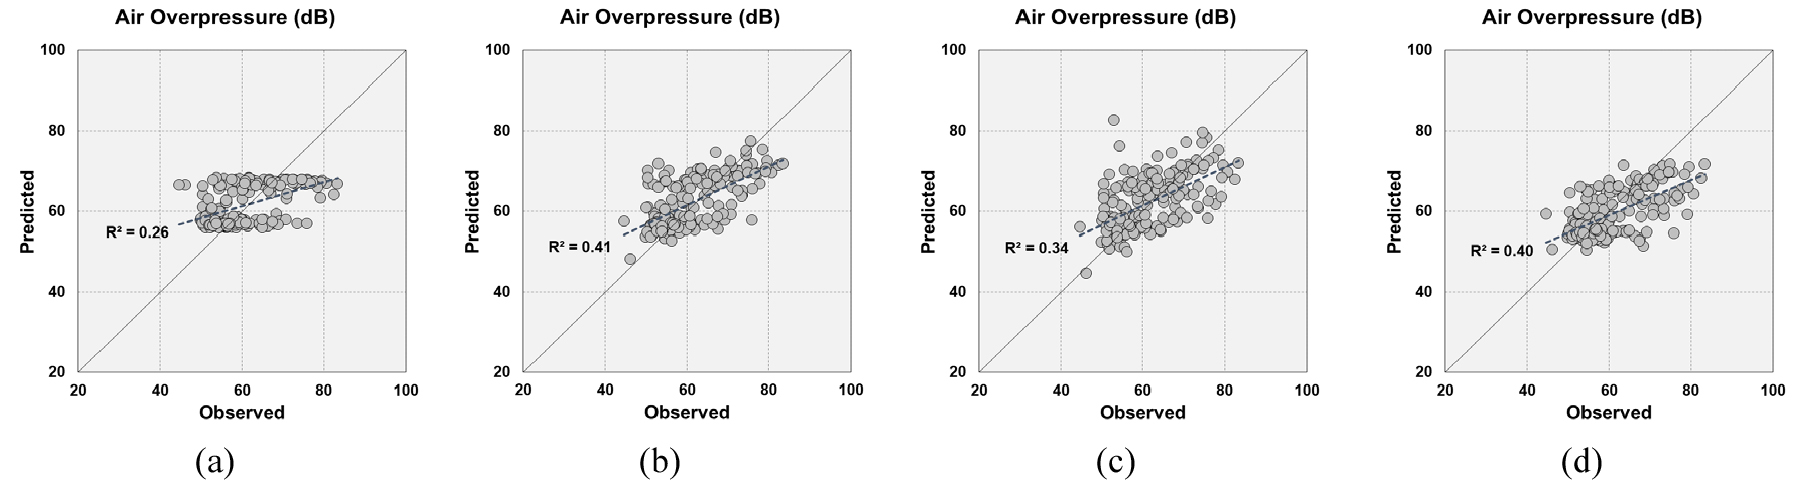
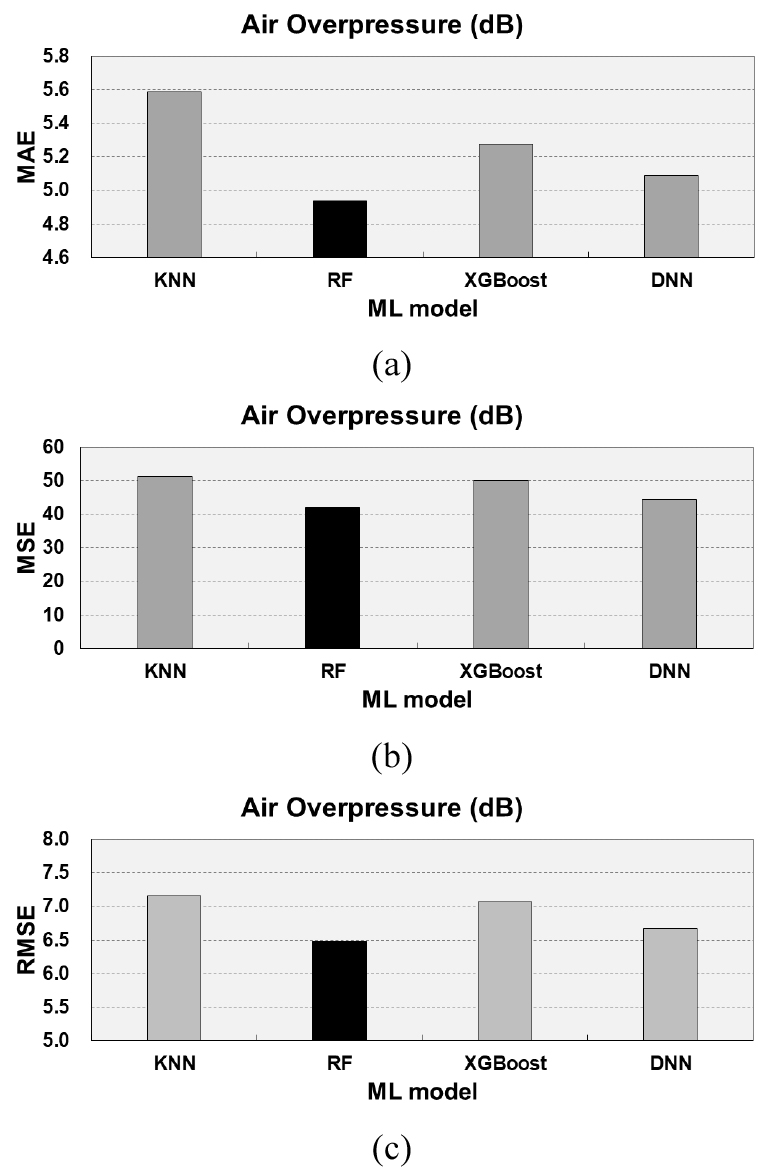
Fig. 6은 테스트 데이터 세트를 이용해 4종의 알고리즘으로 훈련한 머신러닝 모델들의 성능지표를 계산한 후 비교한 결과이다. RF 모델은 MAE가 4.938dB(A), MSE가 42.032dB(A), RMSE가 6.483dB(A)로 분석되었다. Fig. 5와 Fig. 6을 살펴보았을 때, RF 모델은 실측값과 예측값이 약한 상관관계를 보였으나, 예측값의 분포가 편향되지 않고 성능평가의 지표로 사용한 MAE, MSE, RMSE가 다른 세 종류의 모델에 비해 상대적으로 우수한 것으로 나타났다. 따라서 본 연구에서는 RF 모델을 연구지역의 대기소음 예측 모델로 선정하였다.
토 의
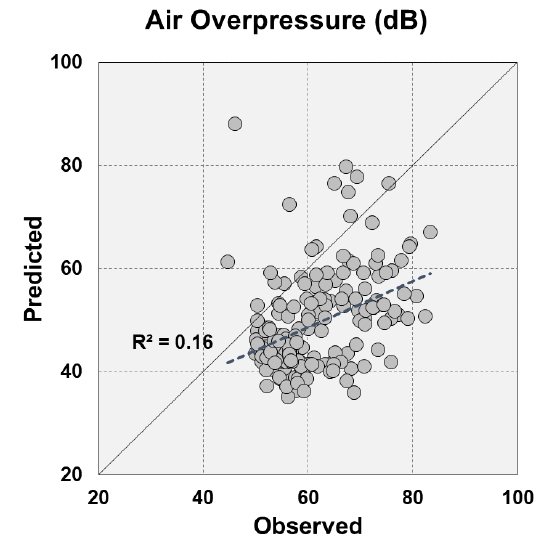
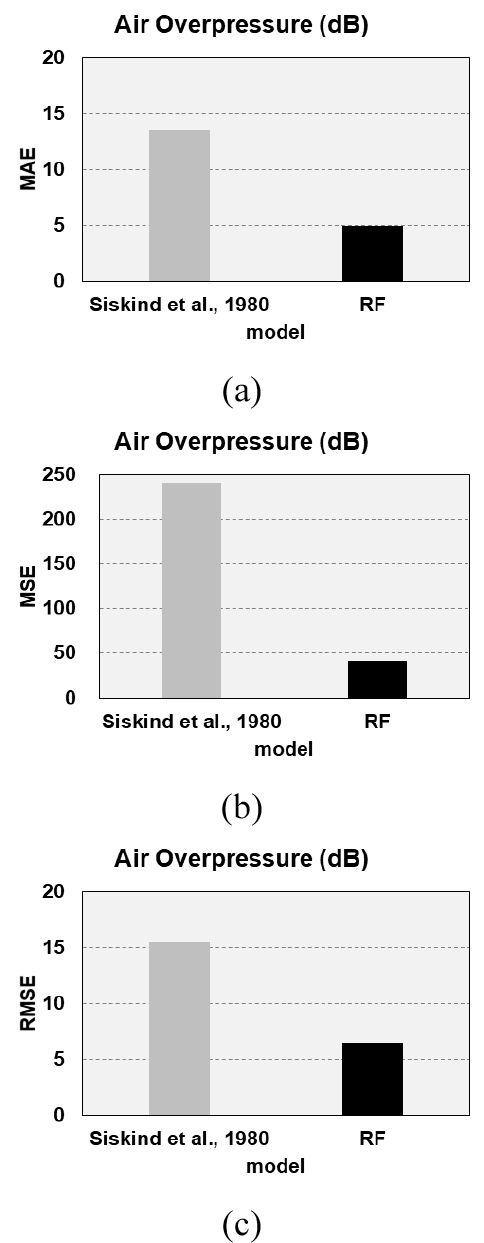
테스트 데이터 세트를 이용해 RF 모델과 Siskind et al.(1980)가 제시한 경험식의 대기소음 예측 성능을 비교해보았다. Fig. 7은 Siskind et al.(1980)가 제시한 경험식을 적용하여 테스트 데이터 세트에 대한 대기소음을 예측한 결과이다. 경험식을 적용한 예측값과 실측값의 결정계수(R2)는 0.16으로 분석되었다. Fig. 5(b)에 제시된 RF 모델을 이용한 대기소음 예측 결과와 비교할 때 경험식을 적용한 결과는 예측값과 실측값을 도시한 점들의 분포가 함수의 중심선에서 상대적으로 더 크게 이격되는 것을 확인할 수 있었으며, 결정계수(R2)도 RF 모델의 결과보다 상대적으로 작았다. 경험식을 이용한 대기소음 예측 결과의 성능지표를 분석한 결과 MAE는 13.506dB(A), MSE는 240.666dB(A), RMSE는 15.513dB(A)로 나타났다(Fig. 8). 따라서 본 연구에서 개발된 RF 모델의 대기소음 예측 성능이 기존의 경험식에 비해 우수한 것으로 판단된다.
한편 연구지역에서는 2022년부터 2033년까지 12년간 석산 개발을 통해 토사(200만 m3)와 석재(4000만 m3)를 생산하여 부산 신항 공사를 위한 골재로 공급할 예정이다. 본 연구에서 개발된 RF 모델은 연구지역에서 향후 석산 개발을 진행하는 동안 발파에 따른 대기소음을 예측하는데 사용될 수 있을 것이다. 예를 들어, Table 5와 같은 발파설계 인자들을 개발된 RF 모델에 입력하면 발파지점으로부터 이격거리에 따른 대기소음을 예측할 수 있다. 이격거리에 따른 대기소음 예측 결과를 거듭제곱 모델(power trendline)을 이용해 추세선으로 나타내면 Fig. 9와 같다. 발파지점으로부터 거리가 멀어질수록 대기소음의 크기가 줄어드는 것으로 예측되었다. 이 결과를 활용하면 발파지점으로부터 일정 거리 내에 사람이나 건물이 존재할 때 대기소음 크기를 사전에 예측하여 피해를 예방할 수 있을 것이다.

결 론
본 연구에서는 경상남도 창원시에 있는 노천 채석장에서 수집된 924개의 발파 모니터링 데이터를 이용하여, 천공장, 저항선, 공간격, 지발당 최대장약량, 비장약량, 총 공수, 에멀전폭약 비율, 이격거리 조건에 따라 발파시 발생하는 대기소음을 예측할 수 있는 머신러닝 모델을 개발하였다. 4종의 머신러닝 알고리즘(kNN, RF, XGBoost, DNN)을 이용하여 모델을 학습시킨 후 예측 성능을 비교한 결과 RF 모델이 MAE가 4.938dB(A), MSE가 42.032dB(A), RMSE가 6.483dB(A)로 평가되어 상대적으로 좋은 성능을 보였다. 그러나 개발된 대기소음 예측 모델은 연구지역의 데이터만을 이용하여 개발하였기 때문에 다른 지역에서는 사용이 어렵다. 연구지역이 아닌 다른 지역에서도 이용 가능한 범용적인 대기소음 예측 머신러닝 모델을 개발하기 위해서는 다른 지역의 데이터를 확보하고 예측 모델의 성능을 개선하기 위한 지속적인 연구가 필요할 것이다.
