

Introduction
Measurement Methods
Study Area
Measurement Results
Surface soil measurement
Groundwater monitoring well measurement
Hot spring well measurement
Discussion
Trial and error in surface soil measurement - artificial hydrogen
Groundwater monitoring well and hot spring well measurement results
Conclusions and Future Plans
Introduction
Unlike hydrocarbons, which are generated solely from organic sources, natural hydrogen is defined as clean hydrogen produced by various mechanisms within the Earth, and it is gaining significant global attention due to its clean nature, no additional processing requirements, and low production costs compared to other hydrogen production methods (green hydrogen, blue hydrogen, gray hydrogen, etc.). In particular, natural hydrogen’s potential role as a future new energy source is attracting attention in line with government energy transition, decarbonization policies, and clean energy expansion strategies. Although research and exploration for natural hydrogen are underway worldwide since its production in Mali, Africa, it remains an underdeveloped field with a lack of clear data on its technical and economic feasibility.
Natural hydrogen exploration methods overseas can be broadly categorized into two types: The first method involves re-confirming natural hydrogen in nearby areas for development purposes, when it was accidentally discovered during past well drilling for petroleum or underground water. The Bourakebougou project in Mali, for example, accidentally discovered natural hydrogen during well drilling in 1987 due to an explosion and subsequently supplied electricity to nearby villages after additional drilling (Hand, 2023). In the case of the Ramsay project on Australia’s York Peninsula, natural hydrogen and helium were discovered in 2023 through additional drilling in a nearby area, based on a review of drilling results from the 1930s (Gold Hydrogen Limited Announcement, 2024a). The operating company was currently conducting long-term production tests after drilling two wells and also completed performing onshore 2D seismic surveys to study structural continuity (Gold Hydrogen Limited Announcement, 2024b). Exploration in the Amadeus Basin of central Australia, near the Pyrenees Mountains in Spain, and in Kansas and Nebraska in the United States also falls into this category (Central Petroleum Limited, 2023; Helios Aragon, 2024; Hydrogen Insight, 2024).
The second method, when there are no existing natural hydrogen discovery wells nearby, involves relatively low-cost soil gas measurements and a study of existing geophysical exploration data. In Brazil, Prinzhofer et al. (2019) carried out periodic measurements at fairy circles of circular, vegetation-free patches and revealed significant fluctuations in hydrogen concentration over time. In the foothills of the French Pyrenees, Lefeuvre et al. (2021) detected several hydrogen hot spots exceeding 1,000 ppm, closely following mapped fault lines which may provide conduits for deep, crustal hydrogen to the surface. In addition, natural hydrogen was detected by the measurements in springs in Albania/ Kosova (Levy et al., 2023), along the 400-m interval in southeastern Saskatchewan of Canada (Max Power Mining Corp., 2024), and in the Bulqize chromite mine (Truche et al., 2024). Most natural hydrogen exploration companies overseas are small-sized enterprises and face difficulties in affording high-cost geophysical exploration or drilling. Therefore, they secure exploration cost through funds at the geophysical exploration and drilling stages after conducting soil gas measurements or reviewing existing data.
In Republic of Korea, some research on natural hydrogen has been reported, but it is still in a very early stage, primarily limited to reviewing overseas papers or domestic ultramafic rocks (Cha and Lee, 2023; Chae et al., 2024; Kim, 2022; Park et al., 2024). This paper aims to share current measurement methods, results, and trials and errors, and provide guidance on future research directions. Even though this study is not an in-depth geochemical/geophysical study, it is significant as it is the first attempt as measuring natural hydrogen in Korea.
Measurement Methods
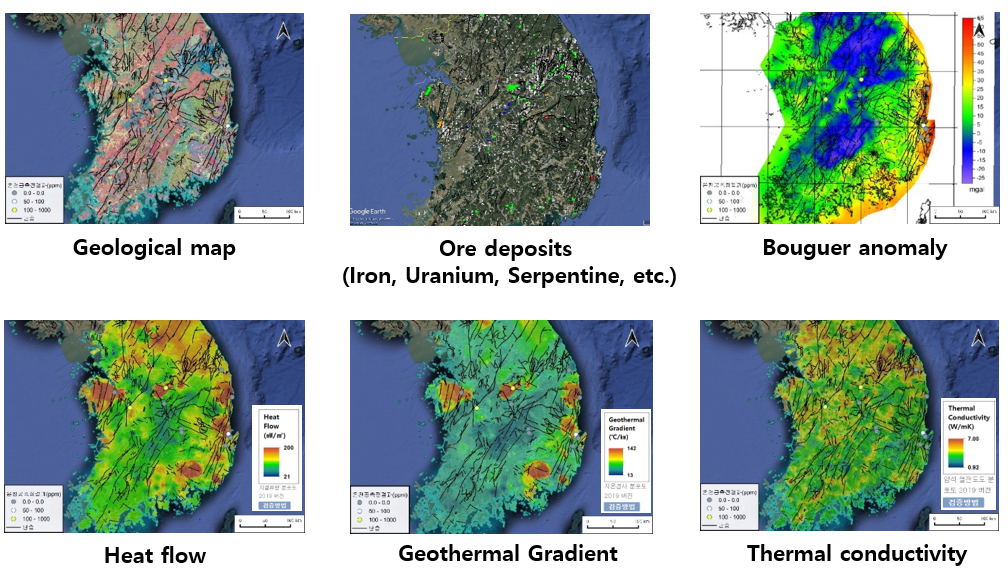
This research was initiated as an in-house project by Korea National Oil Corporation (KNOC) in 2023, aiming to confirm the potential for natural hydrogen deposits in Korea by selecting measurement points using existing technical data and conducting on-site hydrogen measurements. Satellite imagery and geologic maps were used to guide the selection of field measurement sites by delineating the spatial distribution of lithologies, fault lineations related to hydrogen migration and seepage. The mineral deposit locations in Korea were downloaded from the website (Digital Twin Land with V-World) in the form of shape files and the locations of hydrogen-related mineral deposits such as serpentine, ultramafic rock, uranium, and iron were identified one by one. High geothermal heat flow, which is defined as the product of thermal conductivity of rocks and the geothermal gradient, was regarded as favorable, as elevated temperatures significantly enhance hydrogen-generating reactions, while high gravity anomalies are associated with high-density lithologies (e.g., ultramafic rocks). Initially, hydrogen measurements were conducted in the surface soil but the results were unsatisfactory, leading to the need for hydrogen gas measurements at greater depths. Accordingly, the downhole measurements in existing groundwater monitoring wells and hot spring wells were considered for alternative access. Most of the data used in this study were downloaded in digital format and loaded into Google Earth and QGIS to identify their locations.
The main public data utilized in this study are as follows:
a. Geological maps with faults (Geo Big Data Open Platform, 2024)
b. Surface rock type information (Geo Big Data Open Platform, 2024)
c. Geothermal heat flow, geothermal gradient, etc. (Geo Big Data Open Platform, 2024)
d. Location of mineral ore deposits (Digital Twin Land with V-World, 2024)
e. Regional gravity anomaly (Geo Big Data Open Platform, 2024)
f. National groundwater monitoring well information (National Groundwater Information Center, 2024)
g. National hot spring information (National Hot Spring Status, 2024)
Based on the review of the above data, hydrogen gas measurements were conducted from January 2023 to December 2024 in surface soils, groundwater monitoring wells, and hot spring wells nationwide.
The on-site measurement device used was a commercial portable natural hydrogen measurement device, the GA5000, which has a built-in pump and can measure six gases: hydrogen (H2), methane (CH4), carbon dioxide (CO2), oxygen (O2), carbon monoxide (CO), and residual gases (mainly nitrogen). Methane, carbon dioxide, and oxygen are measured in % units, while hydrogen and carbon monoxide are measured in ppm units and are designed not to exceed 1,000 ppm. In 2023, the Gas Tiger 2000 device was temporarily used to take measurements for comparison. Care should also be taken as water intrusion into the equipment can cause operational errors and lead to malfunctions.
The surface soil measurement method and the groundwater monitoring well/hot spring well measurement method are as follows:
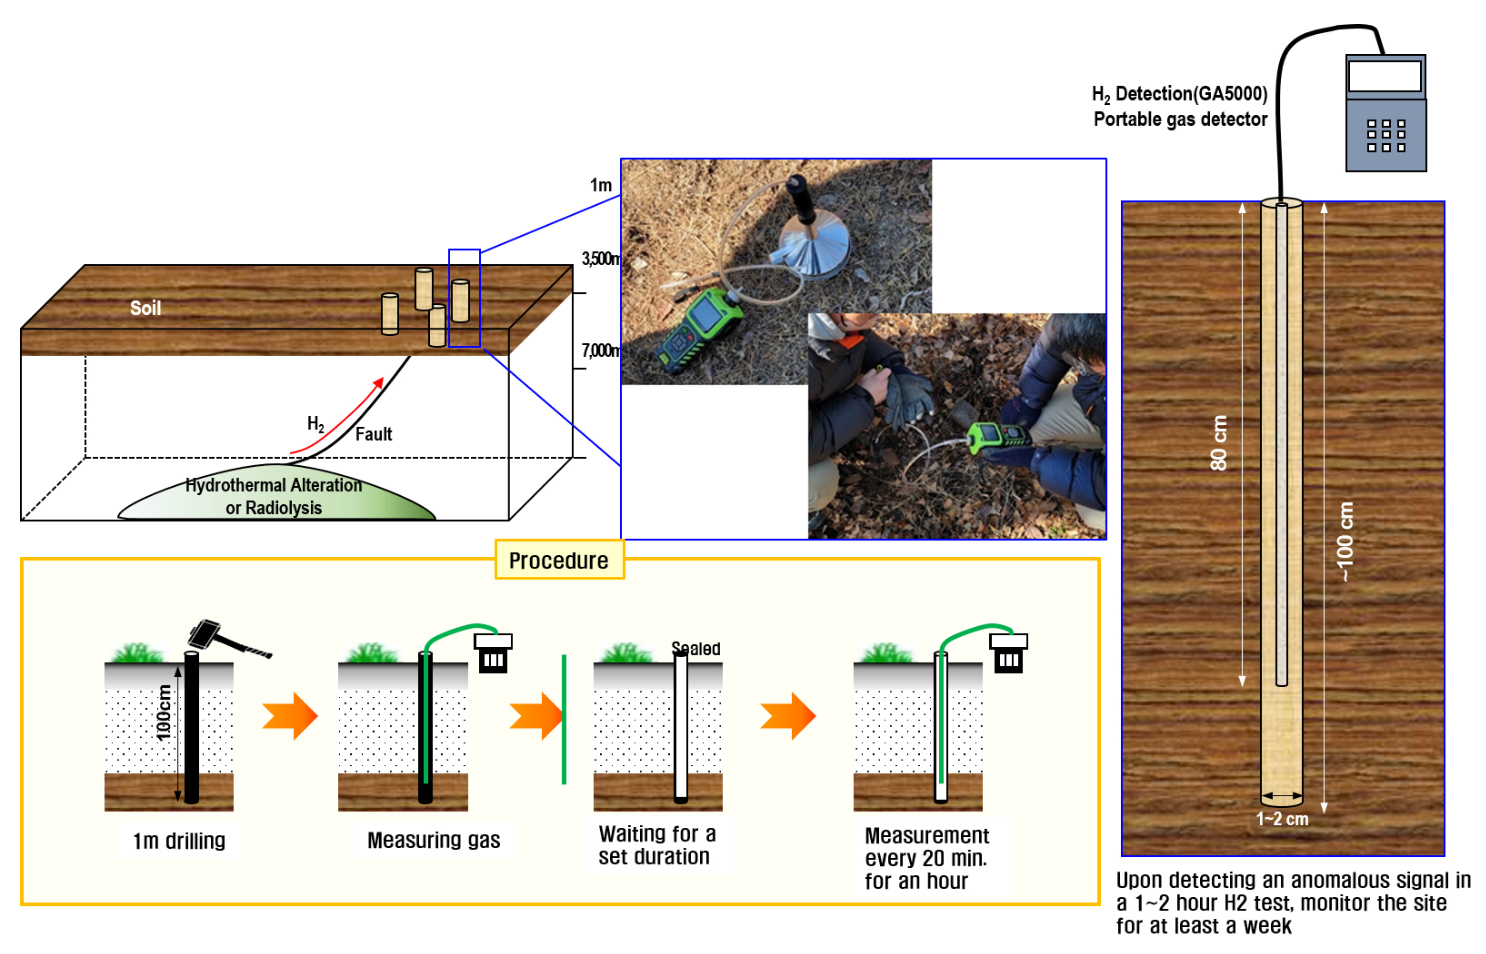
For surface soil measurements, soil gas was measured by drilling 1m into the soil using a hammer and pack or a hammer drill, inserting the GA5000’s measurement tube (inner diameter 5 mm) about 1m deep, and inhaling gas from the borehole at ground level. The pump was operated for the first 120 seconds to record the maximum hydrogen concentration, and then stopped for 20 minutes. After 20 minutes, the pump was re-operated for 120 seconds to record the maximum hydrogen concentration, and this was repeated three times for a total of one hour of measurement (Fig. 1). If a significant value was observed, re-measurements were conducted using the same method at 1–2 week intervals to record changes. Information such as temperature, precipitation, and wind at the location were also identified. Soil gas measurements at a total of 266 points were taken, and 8 sites showing persistence of high hydrogen gas concentration were measured for about a month at 1–2 week intervals for long-term monitoring.
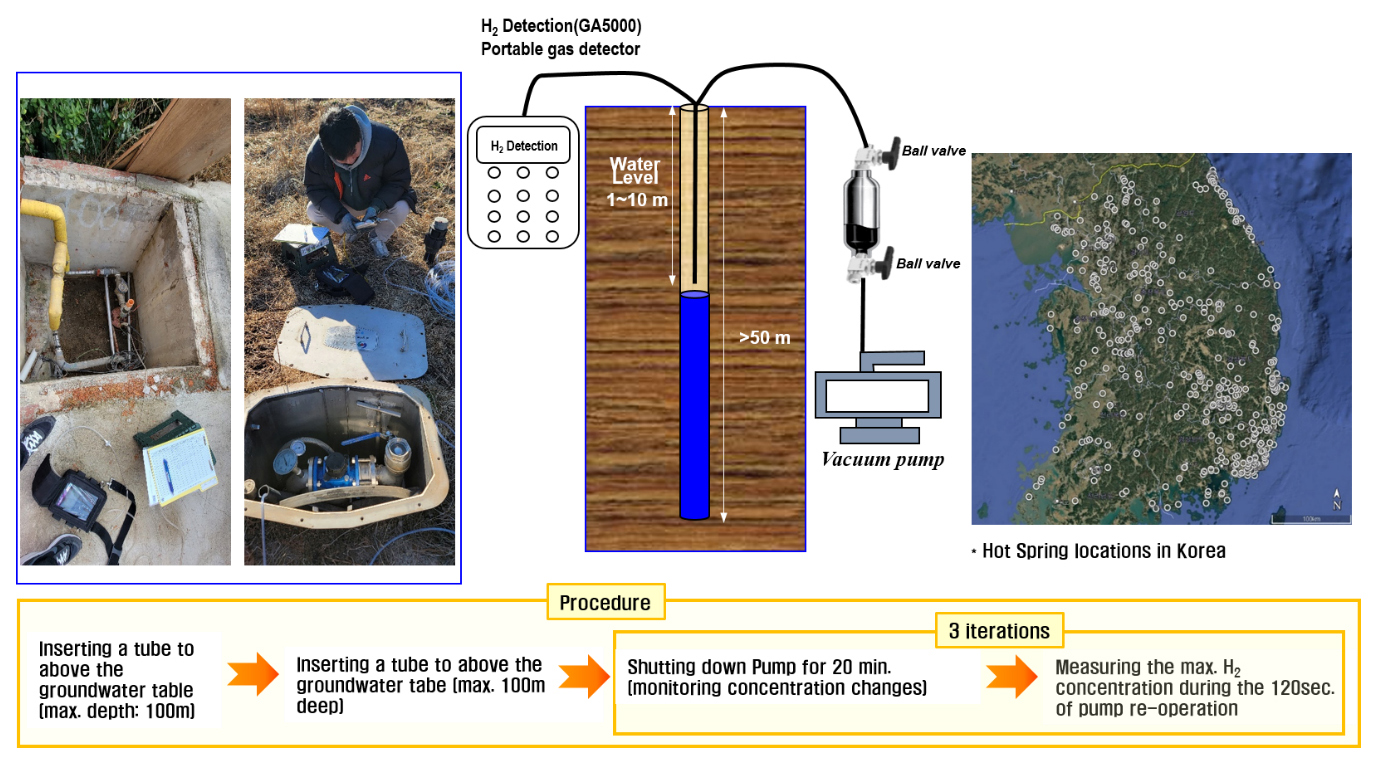
For groundwater monitoring wells and hot spring wells, after checking the groundwater level or hot spring level within the borehole, the measurement tube (inner diameter 5 mm) of the portable natural hydrogen measurement device with a built-in pump was positioned above the water level, and gas concentration was measured by inhaling gas from the borehole at ground level. Unlike surface soil measurements, groundwater monitoring wells and hot spring wells did not require a hammer drill and were measured for only about one hour, as they were drilled several years to several decades ago and thus had no artificial factors affecting the measurement values (Fig. 2). If significant natural hydrogen values were observed, gas samples were collected in Swagelok gas sample cylinders and gas analysis was performed in the laboratory using Gas Chromatography (GC). Hydrogen concentrations were measured in a total of 26 groundwater monitoring wells with the cooperation of the Ministry of Trade, Industry and Energy (MOTIE), the Ministry of Environment (ME), and the Korea Water Resources Corporation (K-Water). For hot spring wells, we contacted more than 200 owners individually, and were only able to measure 15 of them who gave permission (Table 1, Fig. 3).
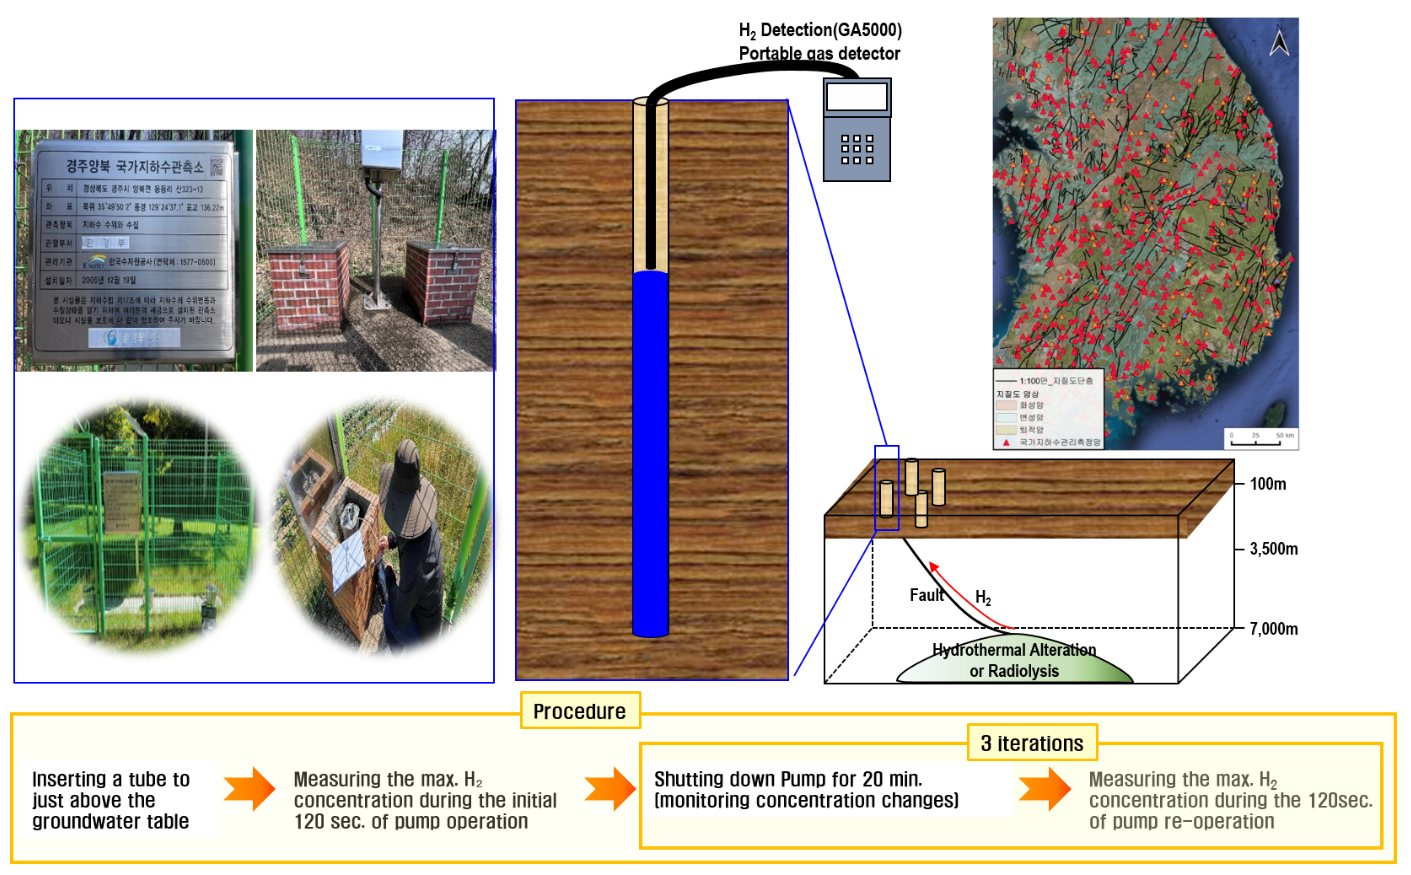
Table 1.
Hydrogen gas measurements
Study Area
The main study areas primarily include Gangwon-do, Chungcheongbuk-do, Chungcheongnam-do, Gyeongsangbuk-do, Pohang, and Ulsan (centered around the Gyeongsang Basin, including parts of the Taebaeksan Basin, Okcheon Belt, and Gyeonggi Massif) (Fig. 4). Since high concentrations of natural hydrogen were reported to have been measured in the Pohang geothermal power plant drill hole (Kim, 2024), measurement locations were selected primarily around the Pohang-Gyeongsang Basin, considering the technical data such as fault extensions on satellite images and geological maps, rock distribution, geothermal heat flux, geophysical characteristics, ore deposit locations, and related papers (Figs. 4 and 5).
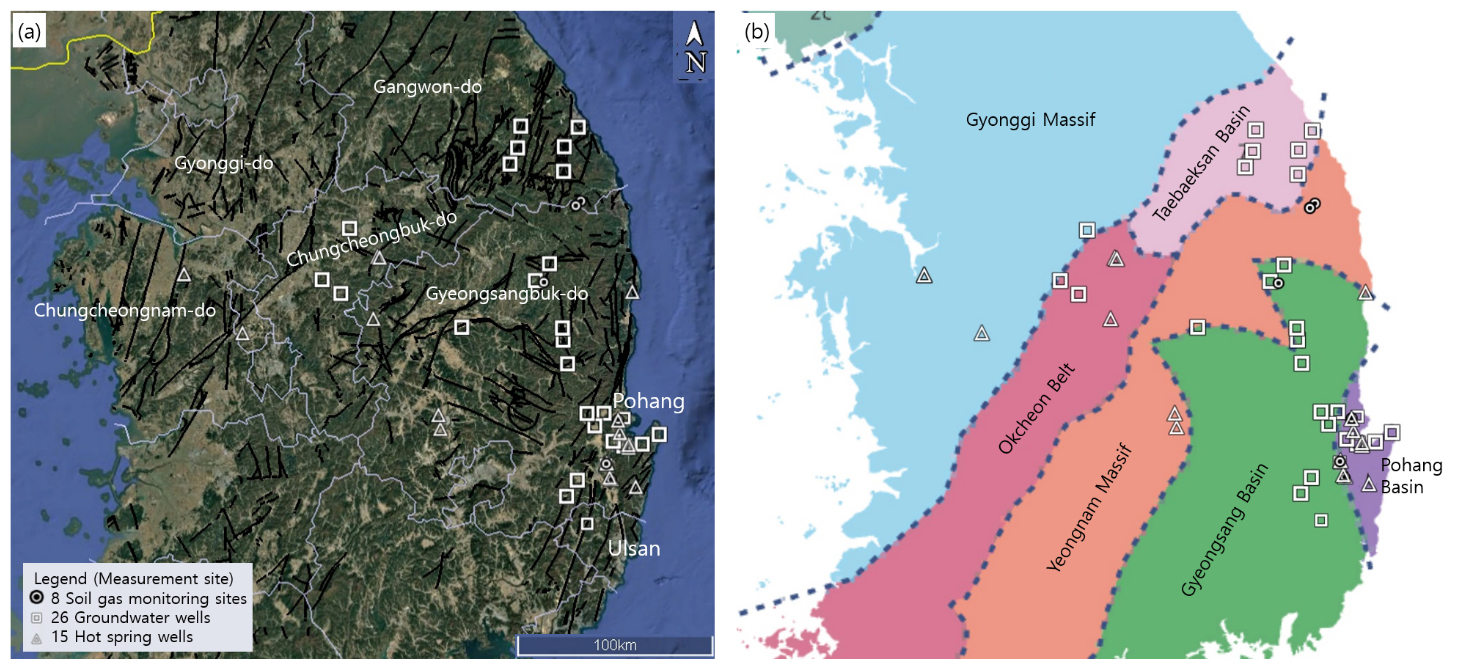
Fig. 4.
(a) Locations of tested soils, groundwater monitoring wells, and hot spring wells. Circles, squares, and triangles denote the hydrogen gas measurement locations for soils, ground water wells, and hot spring wells, respectively. The soil gas measurement locations include only the eight sites where long-term measurements were conducted. (b) Hydrogen gas measurement locations on the tectonic framework of the Korean Peninsula.
While natural hydrogen has various origins, its main origins can be attributed to natural hydrogen generation during serpentinization due to the reaction of mafic rocks and water, natural hydrogen generation due to the oxidation of iron by water, natural hydrogen generation due to the radiolysis of water, and mechanical natural hydrogen generation due to rock fracturing along faults (Kim, 2022). The Taebaeksan Basin is known as a skarn deposit, where contact metamorphism or hydrothermal alteration developed due to the intrusion of igneous rocks into limestone, and the southwestern part of the Gyeonggi Massif has been reported to contain ultramafic rock bodies, as well as serpentine, talc, and asbestos deposits (Chae et al., 2024; Shin and Ko, 2019). In the past, Stonehenge Metals Ltd., an Australian mineral resource exploration company, evaluated uranium mineral deposits in Geumsan and Daejeon in the Okcheon Belt, estimating that uranium capable of supplying 25% of Korea’s domestic nuclear power demand for the next 20 years was deposited there, and attempted to develop it, but it was canceled due to opposition from residents.
Measurement Results
The locations of natural hydrogen measurements taken in surface soil, groundwater monitoring wells, and hot spring wells are shown in Fig. 4, and the measurement results are presented in Figs. 6, 7, 8.
Surface soil measurement
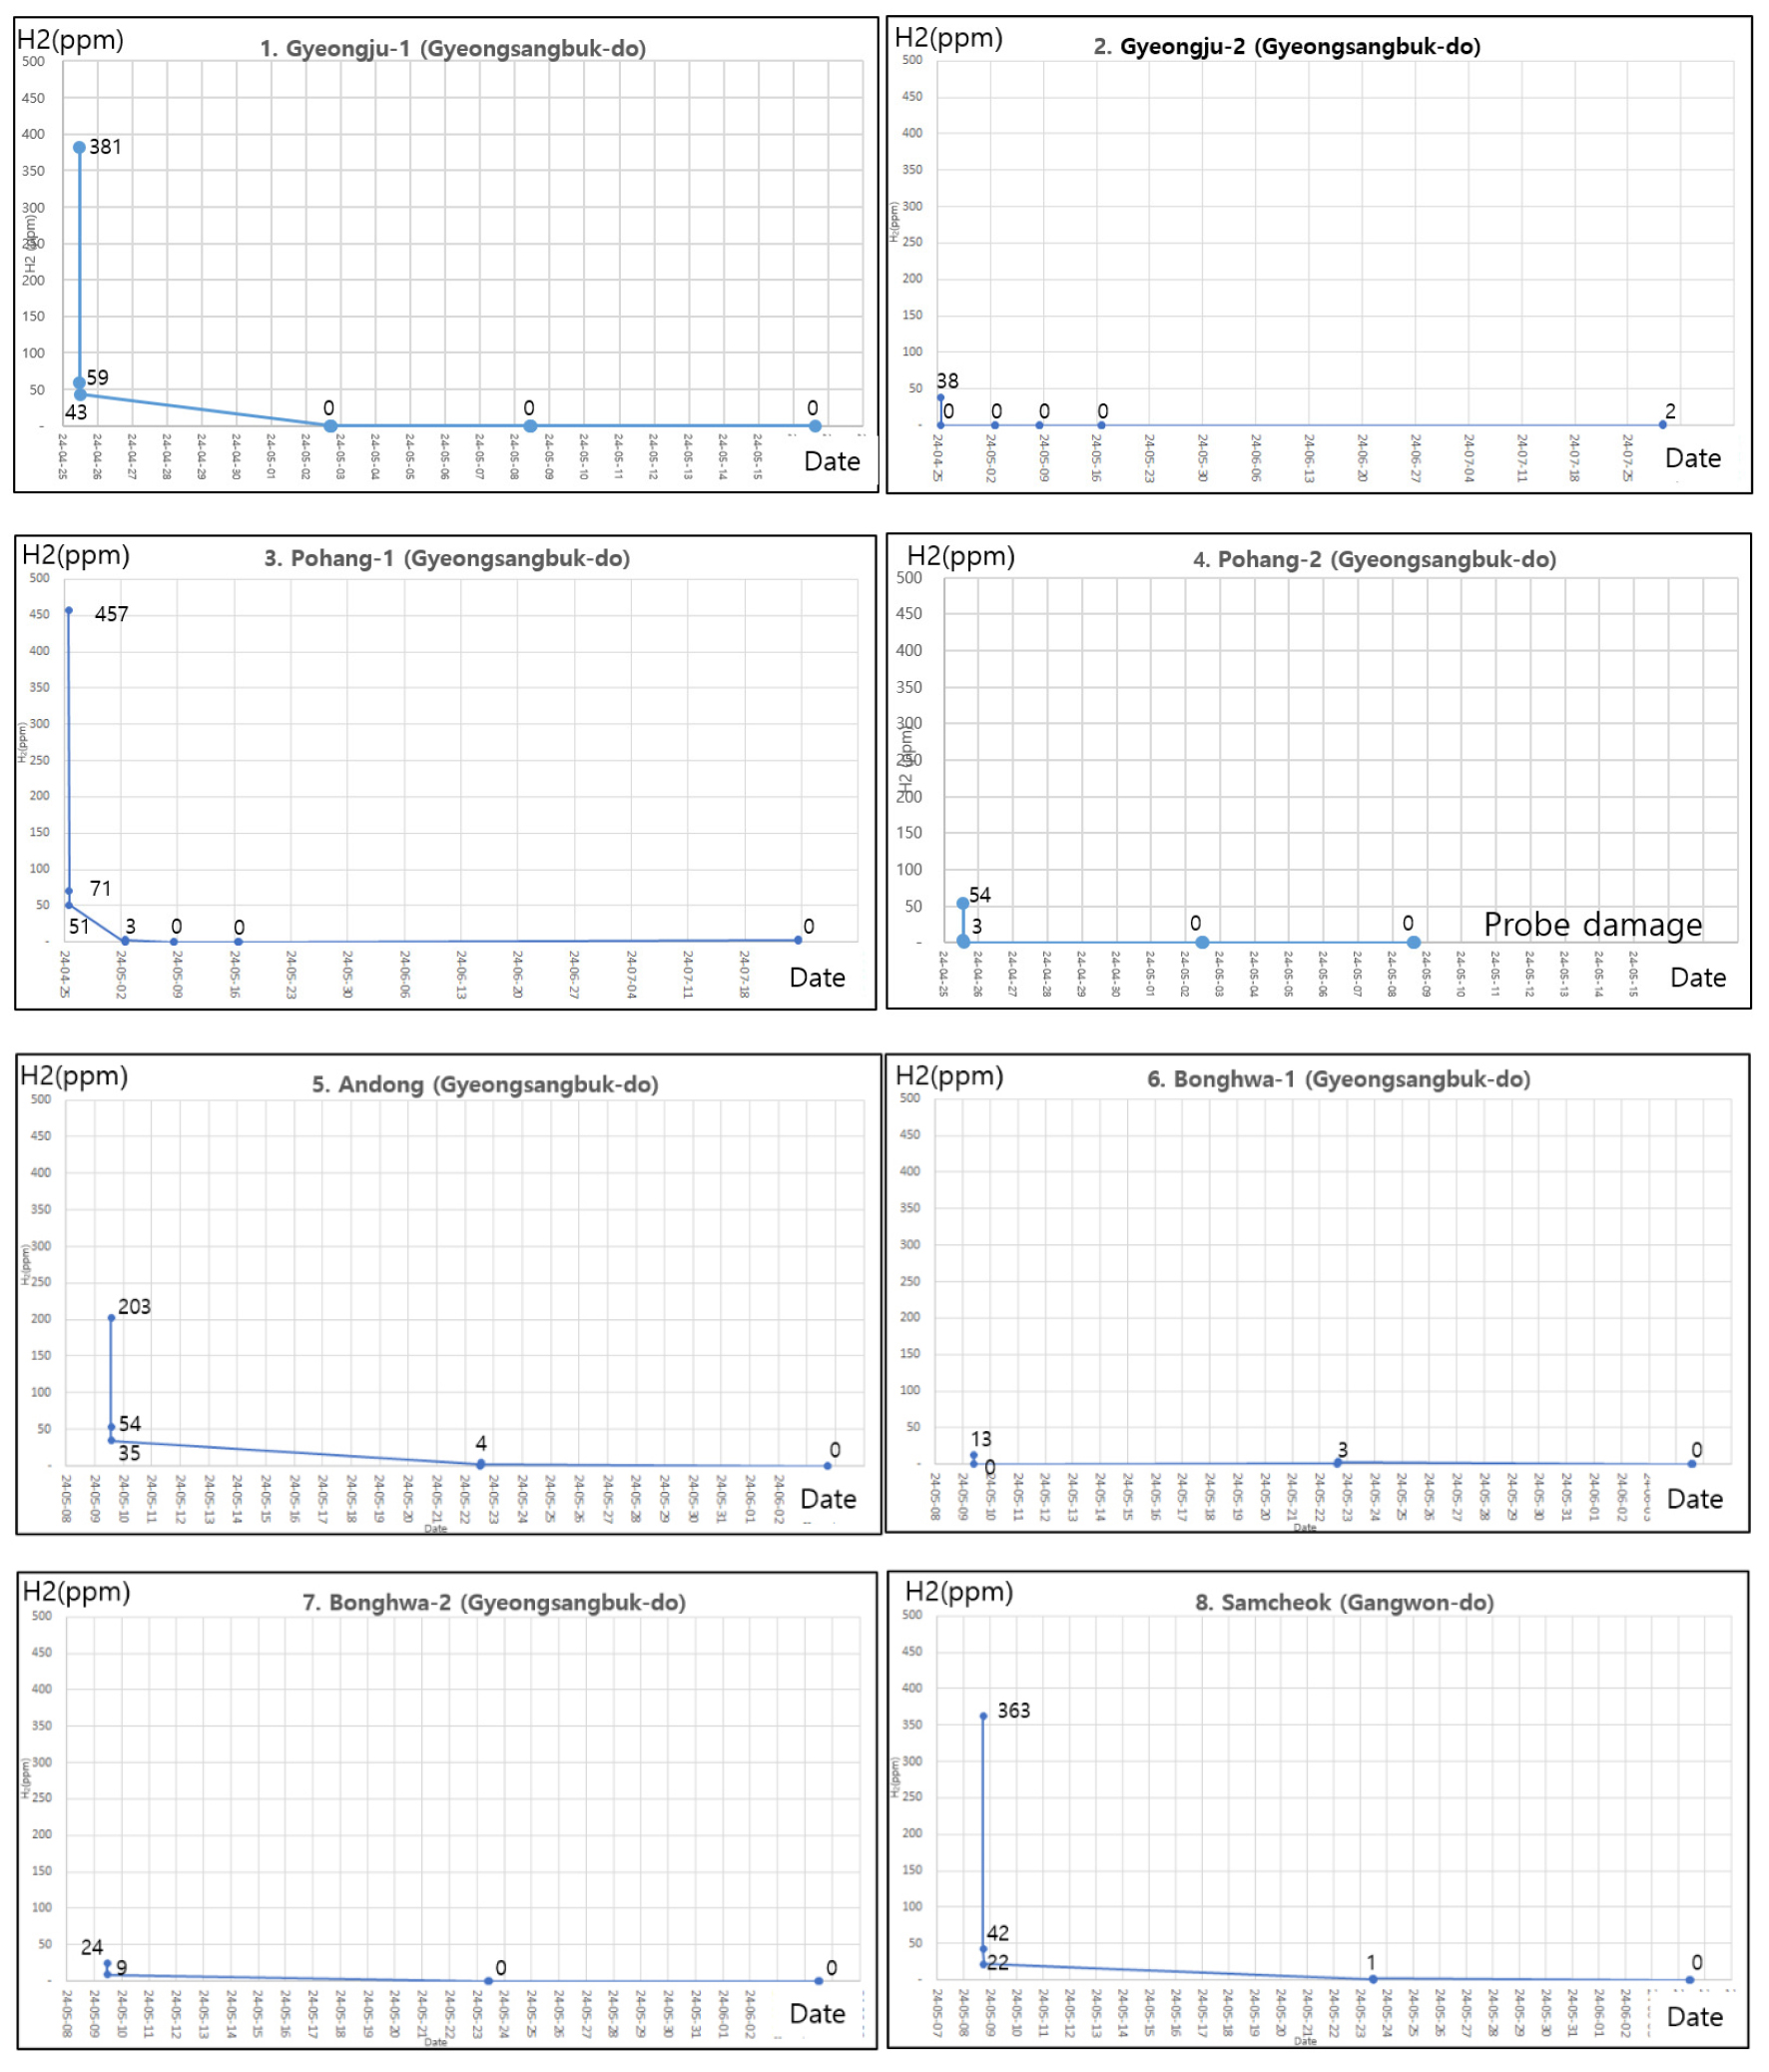
In 2023 and early 2024, natural hydrogen was measured for 1–2 hours immediately after drilling with a hammer drill at 266 sites nationwide. Among these, 8 locations in Gangwon-do and Gyeongsangbuk-do, where abnormal signals of 100 ppm or more were detected, were additionally drilled using a hammer drill and monitored for about a month at 1–2 week intervals from May to June 2024 (Figs. 1 and 4). During re-measurement, four locations recorded values below 100 ppm. Unlike the immediate post-drilling measurements, the hydrogen concentrations at all eight locations rapidly decreased and eventually dropped to zero shortly thereafter (Fig. 6).
Groundwater monitoring well measurement
With the cooperation of K-Water, hydrogen was measured for about one hour in a total of 26 groundwater monitoring wells from June to July 2024 by positioning the measurement tube of the portable natural hydrogen measurement device above the groundwater level (Figs. 2 and 4). Most groundwater monitoring wells were installed in pairs-one borehole in the soil layer and one in the bedrock, and measurements were taken in the borehole installed in the bedrock. As a result, most values were low-close to 0 ppm-except for two locations where maximum values of 31 ppm and 12 ppm were observed (Fig. 7).
Hot spring well measurement
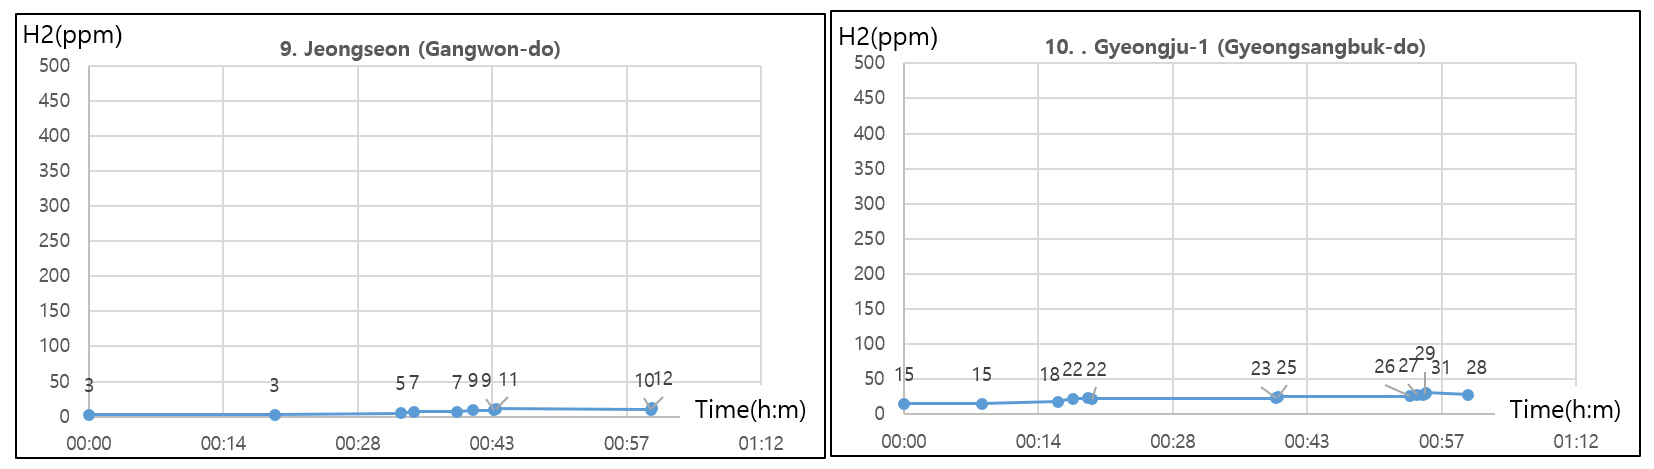
From October to December 2024, hydrogen was measured for approximately one hour at each of the 15 hot spring wells by positioning the measurement tube of the portable natural hydrogen measurement device above the hot spring water level (Figs. 3 and 4). As a result, maximum ppm values were measured at three locations: 414 ppm at Chungju, 100 ppm at Sejong, and 69 ppm at Pohang, respectively (Fig. 8). The values from the remaining wells converged to almost 0 ppm (Fig. 8). Gas samples collected from Chungju and Sejong were analyzed by GC at the Volcanology & Volatiles Laboratory (Group Leader : Professor Hyunwoo Lee) at Seoul National University, resulting in 206 ppm and 56 ppm, respectively, indicating a reduction by half (Table 2). This suggests a high possibility of leakage from the gas sample cylinders during the sampling stage or transportation.
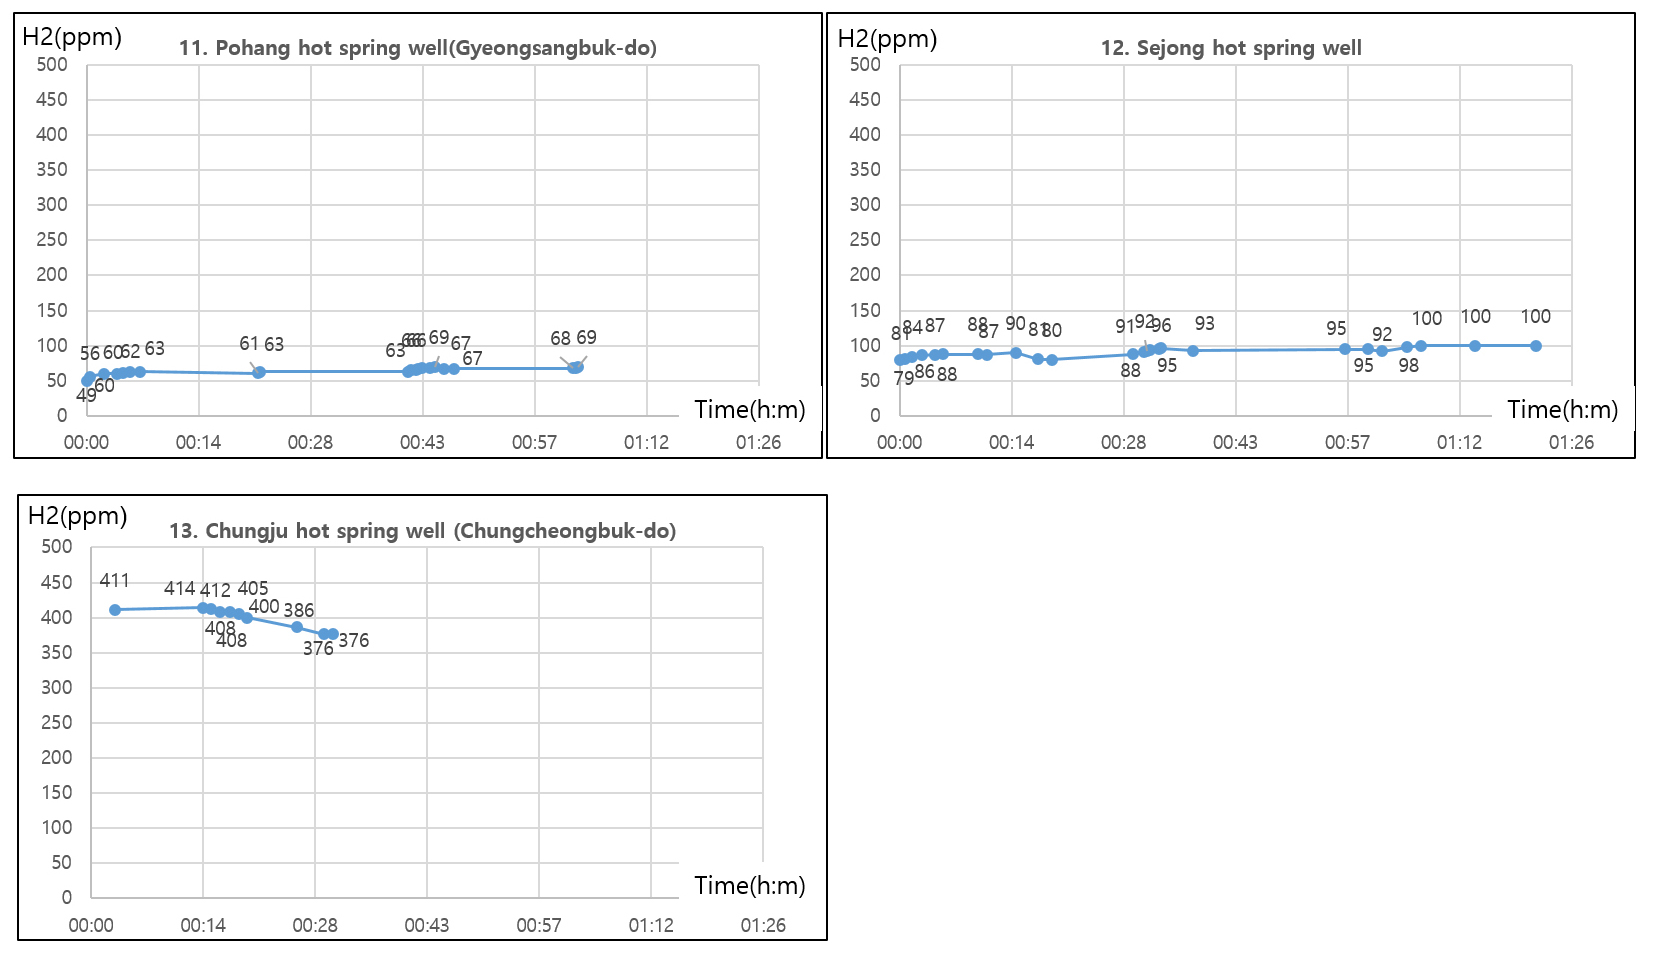
Table 2.
Results of GA5000 and GC measurement
Discussion
Trial and error in surface soil measurement - artificial hydrogen
Soil-gas measurements were first carried out in Korea in 2023, after researching overseas measurement methods, particularly those used in Brazil’s Sao Francisco Basin (Prinzhofer et al., 2019). During domestic soil measurements, hundreds of ppm of artificial hydrogen were generated immediately after hammer drill excavation and converged to 0 ppm in a short time (Fig. 6). This appears to be an effect where artificial hydrogen temporarily and rapidly increases due to friction between the hammer drill and the soil during excavation with a hammer drill, and then disappears. Paul Halas et al. (Halas et al., 2021) measured natural hydrogen up to 3.5% when excavating with a hammer drill at the Fairy Circle in France, but could not detect it during long-term monitoring, and through a separate laboratory study, they proved that a portable hammer drill can generate artificial hydrogen due to the drill bit combustion during excavation. They reported that thousands of ppm or more of artificial hydrogen are generated when using a hammer drill, and the impact is minimal when using a hammer and a pack. However, the measurement in our study confirmed that artificial hydrogen up to 20–30% of that from a hammer drill was generated when a hammer and a pack were used. In the case of surface measurements in the Fairy Circle within the Sao Francisco Basin in Brazil, hydrogen leakage of zero to several hundred ppm periodically occurred for several months (Prinzhofer et al., 2019). Therefore, for surface measurements, long-term monitoring for several days to several months is necessary to confirm the presence of naturally occurring hydrogen, excluding artificial hydrogen. However, if it rains during the long-term measurement period (several days to several months), water clogging may occur in the detection probe inserted into the 1m hole due to the rain, leading to a halt in measurements at the same location. Location 4 in Fig. 6 is an example where measurements were stopped due to water clogging. Although long-term monitoring products designed to prevent this have been released overseas, issues such as high cost, theft, and damage remain unresolved.
Groundwater monitoring well and hot spring well measurement results
Based on these experiences, methods to eliminate artificial hydrogen were sought, leading to a shift to utilizing existing boreholes such as groundwater monitoring wells and hot spring wells. The advantages of measuring in groundwater monitoring wells or hot spring wells are that the possibility of artificial hydrogen generation is very low since at least several years have passed since drilling, and natural hydrogen concentrations can be measured at a deeper depth. The average drilling depth of groundwater monitoring wells is 70m, and the depth from the surface to the groundwater level is mostly within 10 m. In the case of hot spring wells, the average drilling depth ranges from 500 to 1,000 m, and the depth from the surface to the hot spring water level is tens of meters or more. However, if there are no groundwater monitoring wells or hot spring wells in the area of interest, natural hydrogen cannot be identified. Since K-Water manages over 900 groundwater monitoring wells nationwide, natural hydrogen concentrations could be measured with the cooperation of the MOTIE, the ME, and the K-Water. And although there are over 400 registered hot springs, they are managed by individual businesses, so measurements were conducted after individual contact and permission.
Significant hydrogen concentrations were confirmed in only 3 hot spring wells that measured 69–414 ppm. The hot spring wells showing relatively high hydrogen concentrations are located at: 1) near the boundary between the Okcheon Belt and the Taebaeksan Basin, 2) the Gyeonggi Massif adjacent to the Okcheon Belt, and 3) within the Pohang Basin (Figs. 4 and 9). The Chungju hot spring well is located near an area with a high concentration of iron ore deposits and where uranium deposits are linearly distributed. The Sejong hot spring well is surrounded by uranium deposits to the east and south, and ultramafic rocks/serpentine deposits to the east. The Pohang hot spring well is located within the Pohang Basin and is about 7.6 km away from the Pohang geothermal well where high concentrations of hydrogen were confirmed.
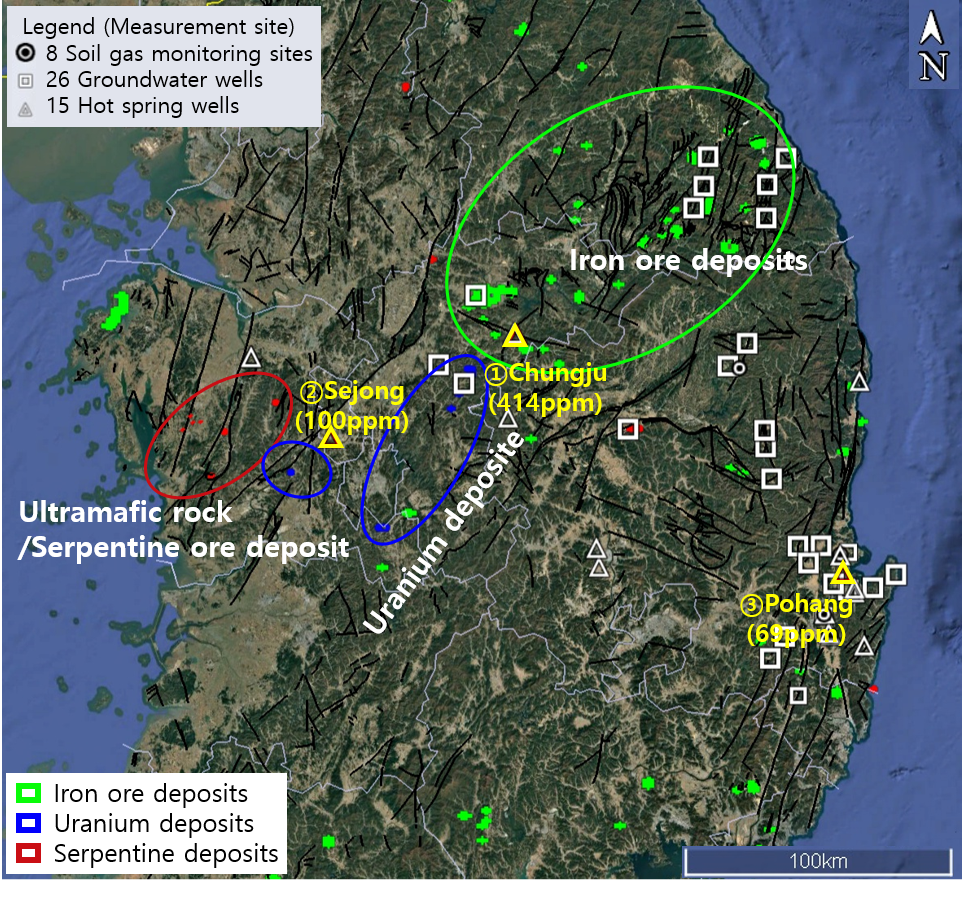
Fig. 9.
Hydrogen gas measurement results. Locations of mineral deposits (iron ore, uranium, and serpentine) and hot spring sites with hydrogen concentrations > 50 ppm (yellow triangles). ① Chungju hot spring well (Max. 414 ppm), ②Sejong hot spring well (Max. 100 ppm), and ③ Pohang hot spring well (Max. 69 ppm).
Taebaeksan basin and Okcheon belt iron ore deposits
The Taebaeksan Mineralized Zone, where the Chungju hot spring well is located, is distributed in the northeastern part of the Okcheon Belt and the Taebaeksan Basin. This zone is characterized by contact and hydrothermal alternating deposits formed by the intrusion of igneous rocks into a broad limestone zone (Shin and Ko, 2019). The genesis of skarn deposits in this area is closely related to magma-hydrothermal systems associated with the Mesozoic Cretaceous Bulguksa orogeny, which intruded limestone and carbonate rock layers of the Paleozoic Joseon Supergroup and Okcheon Supergroup. Skarn deposits are accompanied by abundant metal deposits such as iron, zinc, molybdenum, gold, and silver, and water can easily move along complex faults formed during igneous intrusion. Compared to the distribution of developed deposits within the Taebaeksan Basin, these deposits are characterized by their distribution at the edges of low gravity anomalies or near the boundaries between low and high anomalies, and based on gravity anomaly characteristics, it can be interpreted as implying that they are connected to larger granite bodies (magma-hydrothermal system) in the deeper part. The hydrogen concentration anomaly in the Chungju hot spring well suggests that natural hydrogen may have been generated by the reaction between iron ore and water during such igneous intrusion. Furthermore, recent research results (Geymond et al., 2023) report that iron ore can produce hydrogen even at low temperatures in reaction with water, necessitating additional measurements and in-depth research in this area.
Okcheon belt uranium deposits
Uranium-bearing layers found in the western Okcheon Belt and southwestern Gyeonggi Massif are largely known as carbonaceous black slate of the Precambrian-Paleozoic Okcheon Supergroup and Mesozoic granite. The Okcheon Belt black slate is distributed for about 100 km in a northeast-southwest direction, forming representative uranium metallogenic provinces in Goesan, Boeun, and Geumsan areas. The uranium-bearing layer consists of 10–40 m wide carbonaceous slate enriched in uranium and surrounding black slates. The uranium grade in this carbonaceous black slate is low, at 100~600 ppm (Shin, 2019). Furthermore, Shin et al. (2012a) suggested from the occurrence and geochemical characteristics of uranium-bearing carbonaceous slates that these rocks were influenced by sedimentary processes accompanied by submarine volcanic activity or secondary hydrothermal activity under high-temperature reducing conditions, rather than typical seawater-derived sediments.
The second uranium-bearing layer, where most high-concentration uranium groundwater is found, is primarily from Jurassic granite in the Gyeonggi Massif and Okcheon Belt, and partly from Cretaceous granite in the Okcheon Belt. It is rarely found in Jurassic granite of the Yeongnam Massif and Cretaceous granite of the Gyeongsang Basin. Jurassic granites (S-type) in the Gyeonggi Massif and Okcheon Belt were formed during the Jurassic period, simultaneously with the Daebo orogeny, as products of partial melting of subcrustal material or crustal contamination during ascending granitic magma from the mantle in a reducing environment, resulting in a high proportion of crustal material within the magma (Kim, 1992). In contrast, Cretaceous Bulguksa granites were formed during the Cretaceous period through fractional crystallization of mantle-derived magma in an oxidizing environment without mixing with crustal material. In the case of the Jurassic granite of the Yeongnam Massif, the low uranium contents is due to its I-type nature, which features inherently low crustal input and limited magma differentiation. This difference in rock origin is a major geological factor explaining why high-concentration uranium groundwater is concentrated in Jurassic granite areas rather than Cretaceous granite areas (Hwang, 2018). A report analyzing uranium content in groundwater in the granite zone of Cheongju-Jecheon-Goesan-Boeun areas states that the highest concentration was in Boeun groundwater located in Jurassic Boeun granite, ranging from 194−332 μg/L (0.194−0.332 ppm). The lowest was in Jecheon groundwater located in Cretaceous biotite granite, ranging from 0.6−4.5 μg/L (0.0006−0.0045 ppm), with an average range of 2.9−267.1 μg/L (0.0029−0.267 ppm) for each groundwater monitoring well (Shin et al., 2012b). These results show that the uranium concentration in Jurassic granite is much lower than in carbonaceous black slate. However, there is no research or experiment globally on how much radioactive elements are needed for natural hydrogen generation or how they react, thus requiring additional measurements or work.
Gyeonggi massif ultramafic rocks
Chae et al. (2024) reported the occurrence of relatively large ultramafic rock bodies (including serpentinite) in areas such as Hongseong, Andong, Ulsan, and Gapyeong through a study on the distribution and genesis of ultramafic rocks (including serpentinite) in the Korean Peninsula. In the Gyeonggi Massif, specifically in the Hongseong and Gwangcheon areas (Southwest Gyeonggi Massif), ultramafic rocks occur as isolated bodies within Precambrian gneiss complexes. The ultramafic rocks in this region are composed of dunite or harzburgite, a type of peridotite, and are presumed to be alpine-type ultramafic rocks derived from a depleted upper mantle. The ultramafic rocks discovered in the Hongseong area are considered to have been exposed to the surface as a result of mantle uplift due to the continental collision on the Korean Peninsula during the Permian-Triassic period (Jeong and Oh, 2021). These ultramafic rocks are composed of olivine with high forsterite composition and orthopyroxene with a high magnesium ratio (Song et al., 2004).
Pohang basin
While the persistent hydrogen concentration in Pohang hot spring well has various possibilities that require further investigation, a tentative assessment of the fault’s role was made based on the measurement results from the nearby Pohang geothermal drill holes. In 2024, hydrogen was measured in the Pohang geothermal drill holes PX-1 and PX-2, which are located approximately 6m apart, near the epicenter of a magnitude 5.4 earthquake that occurred in 2017. High concentrations of hydrogen were detected only in PX-2, which penetrated a deep fault zone at approximately 3.8 km depth (Kim, 2024). Approximately 70% of the 2,300 m3 of water injected for the operation of the geothermal system at the Pohang geothermal drill hole was lost to the rock formation (Permian granodiorites) and was not recovered (Korean Government Commission on the Cause of the Pohang Earthquake, 2019). It has been reported that the casing in the PX-2 drill hole was ruptured or damaged at a depth of 3.8 km, suggesting that the high hydrogen concentration may have been generated by the reaction of the unrecovered water with iron-rich rocks in this fault zone.
Conclusions and Future Plans
Natural hydrogen is clean hydrogen generated by various mechanisms within the Earth, and its potential role as a future new energy source is gaining attention in line with government energy transition, decarbonization policies, and clean energy expansion strategies. However, there is currently a lack of clear data on its technical and economic feasibility. KNOC reviewed available public technical data and conducted hydrogen gas measurements in domestic surface soil, groundwater monitoring wells, and hot spring wells from 2023 to 2024.
In surface measurements, high concentrations of hydrogen generated from the soil after hammer drill excavation did not persist and converged to 0 ppm after 1–2 weeks. It may be due to artificial hydrogen temporarily generated by heat and pressure at the contact surface between the drill, soil, and moisture when using a hammer drill. In groundwater monitoring wells and hot spring wells, the possibility of artificial hydrogen generation is very low as at least several years have passed since drilling. High concentrations (69 to 414 ppm) of hydrogen were measured in 3 hot spring wells where measurements could be taken at relatively deeper depths, and it is judged that they are highly related to nearby mineral deposits (iron, uranium, serpentine) and ultramafic rock bodies.
For further quantitative identification, geophysical and geochemical surveys, as well as exploration drilling, are necessary. To achieve this, it is also important to narrow down the target areas for detailed exploration by conducting hydrogen system and structure studies over broad regions. In near future, we have a plan to systematically identify potential natural hydrogen-bearing areas by evaluating the regional distribution possibilities of key components of the hydrogen system and creating an integrated map (e.g., Gelman et al., 2025). Through this process, the study area will be progressively narrowed down to regions with high potential.
