Introduction
Effects of Caprock in Surface Mine Blasting
Numerical Analysis to Evaluate the Effects of the Caprock
Numerical modelling
The geometry of the surface bench blasting model
Simulation design
Analysis Results
Effects of caprock
Effects of pocket charge
Effect of the pocket charge location
Conclusion
Introduction
Even though caprock is a widely used terminology in the resource sector, there is no clear-cut definition of rock in the mining industry due to the uniqueness of geological features in every single mine site. In general, the caprock consists of more resistive material than the strata below with a better ability to withstand naturally or artificially induced alteration including weathering, eroding or blasting (University of Calgary, 2023). Blasting thick caprock overlaying the softer strata in surface mines has been the main culprit in producing oversized boulders. Also, blasting the caprock without thorough site-specific analysis often results in being heaved instead of fragmented in many open pit mines because the layer is acting as an inhibitor of well-developed fragmentation propagation (Dyno Nobel, 2020). Poor fragmentation due to caprock results in quality control failure and increases operational time and costs. This is due to unintended secondary breakage of boulders, loss of truckload consistency, reduced excavation rates, and more frequent maintenance due to potential damage to mining equipment. More importantly, oversized rocks can potentially threaten mine personnel, as the rehandling procedure requires hazardous activities such as hammering and secondary blasting (Singh and Narendrula, 2010).
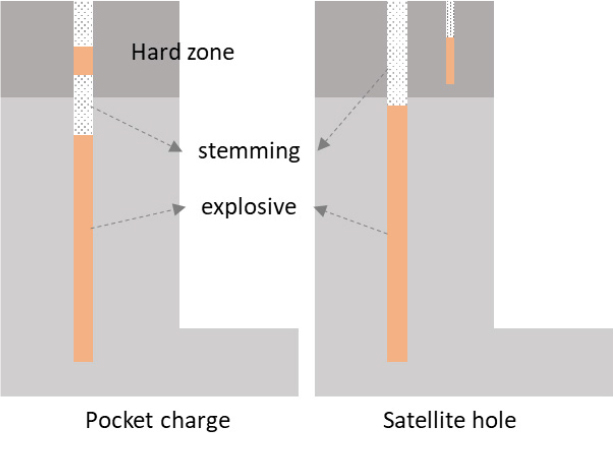
In many cases, the surface bench blasting design consists of a column of explosive charge and stemming as shown in Fig. 1. The stemming is packed with an inert material to retain and confine the explosion gases produced by blasting for better fragmentation in general. With inadequate stemming, the blasting operation can produce fly rock, air blast and dust due to a premature escape of blast fume into the atmosphere.
Despite the critical role of stemming, excessive stemming can lead the top part of the bench to create a large number of boulders due to the lack of an explosive energy projection area. Likewise, Oates and Spiteri (2021) found that the hard caprock near stemming can act as an inhibitor that prohibits a well-established network of rock breakage.
Despite the urgent need to address the caprock-related fragmentation issue, comprehensive theories on caprock blasting remain underdeveloped due to a lack of research and case studies. Ayala Carcedo and Francisco Javier (1995) and Gokhale (2010) have introduced the fundamental concept of pocket charges, which involve the addition of small amounts of explosives within the caprock layer as a remedial blasting method. This approach aims to improve fragmentation propagation in targeted areas. However, there are no explicit guidelines for configuring these charges, such as determining their quantity or placement.
The purpose of this study is to propose an optimal bench blast design in the presence of a caprock issue. It also aims to achieve a balance between effective fragmentation and minimal problems with flyrock and dust. The methodology involves a series of research stages that utilize numerical and empirical analyses. These analyses will be performed using the AUTODYN nonlinear dynamic modelling software, which is based on Finite Element Analysis (FEA), and the Scaled Depth of Burial (SDOB) method, respectively.
Effects of Caprock in Surface Mine Blasting
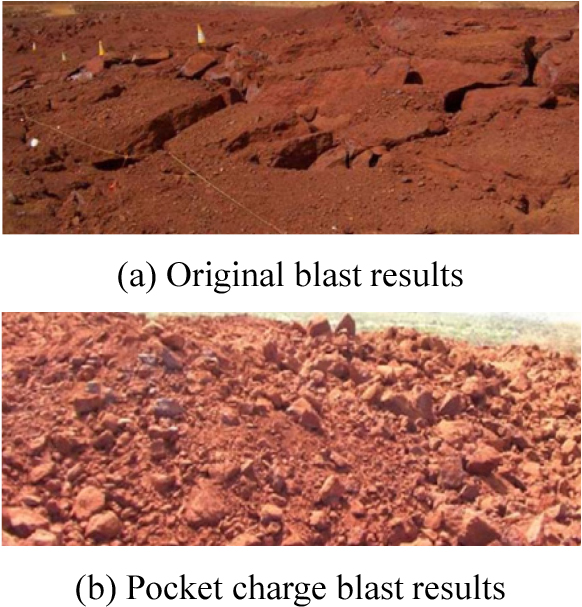
Caprock on the top part of the bench is acting as an obstacle for well-developed fragmentation because it has more ability to resist energy from explosion than the softer layer, confining the energy under the caprock layer. To blast a bed of caprock greater than 1 metre thick in the upper part of the burden, load smaller blasthole and tighter blast pattern dimensions or an explosive of higher density are often beneficial to avoid blocky fragmentation. An extra charge of explosive in the inert stemming is called a deck or pocket charge (notated as ‘pocket charge’ in this study). The pocket charge or a satellite hole in Fig. 2 is used to concentrate explosive charges in the hard rock layer, improving fragmentation. The satellite charge consists of short holes with smaller diameters drilled between the main blast holes and loaded with a light charge of explosives. As both charge methods provide extra energy to the blasting, the main charge length should be reduced slightly to minimize flyrock and airblast effects as the extra charge reduces stemming length, reducing the effectiveness of confinement (US Bureau of Reclamation, 1991). Even though the consequence of caprock blasting is significant in mining operations, there are limited numbers of case studies regarding the pocket charge application as the charge requires additional costs of operation. Orica Mining Services (2009) conducted caprock blasting with pocket charge in an open-cut iron ore mine to minimise blasting-induced vibration for a nearby archaeological significant site as well as the oversized fragments in the cap rock region of the bench. The study revealed that the cap rock experienced heaving instead of fragmentation due to the reflection of shockwaves off the cap rock surface.
The initial caprock blasting resulted in producing a layer of heaved boulders near the surface area as shown in Fig. 3 (a) and a double primed pocket charge blasthole results are in Fig. 3 (b) that shows improved rock fragmentation with the pocket charge blasting.
In Minnesota US, a company spent unbearable operational costs to blast individual boulders after initial excavation as the core stones were randomly scattered in the layer. In this case, it has been suggested to utilize many tightly positioned pocket charge loading or satellite charges with small blasthole diameters to break individual hard blocks in the stemming zone effectively can reduce potential secondary handling of boulders such as secondary blasting, haulage or further crushing that might require more costs than the operational costs of pocket charging (Oriard, 1987).
Numerical Analysis to Evaluate the Effects of the Caprock
This chapter demonstrates the numerical analysis to evaluate the effects of caprock in blasting operations. Mining companies have traditionally relied on standard bench blasting designs built based on their empirical design experiences considering the analytical analysis of former blast results on sites. In general, the universal site blast designs are applied but they may not provide optimal results due to their inability to account for unique geological factors.
The simulation was started to build a basic bench blast model configuration derived from Langefors’ model without a caprock layer (Langefors and Kihlström, 1967). The next round of simulation involved altering the pocket charge length in the caprock layer ranging from 5 to 35 per cent of stemming length with a 5% increment. The last simulation was the optimisation of the caprock bench blast by adjusting the pocket charge location from 40 to 55 per cent from the bottom of the caprock layer with a 5% increment. As the amount of pocket charge increased, the same amount of bottom charge decreased accordingly.
Numerical modelling
The process of numerically simulating blast loading on rock-like materials necessitates an Equation of State (EOS) and an appropriate material constitutive model. These components are integral in demonstrating the dynamic, non-linear behaviour of materials under high strain rates. In this study, the Riedel, Hiermaier, and Thoma (RHT) material model (Riedel, 2004) is utilised via the AUTODYN code (ANSYS, 2023). the boundaries in the deviatoric stress space are illustrated in Fig. 4.
The RHT model operates on the principle that a material exhibits elasticity until the stress level reaches the elastic limit surface . Once this threshold is exceeded, the material transitions to plasticity, with plastic strains developing based on linear hardening characteristics. Upon attaining the failure surface , the plastic strain propels the material's damage until the total plastic strain which is equivalent to the failure strain . This point corresponds to the residual strength surface shown in Fig. 4. The damage level in the RHT model is thus quantified as , where values of 0 and 1 represent the failure and residual strength surfaces respectively.
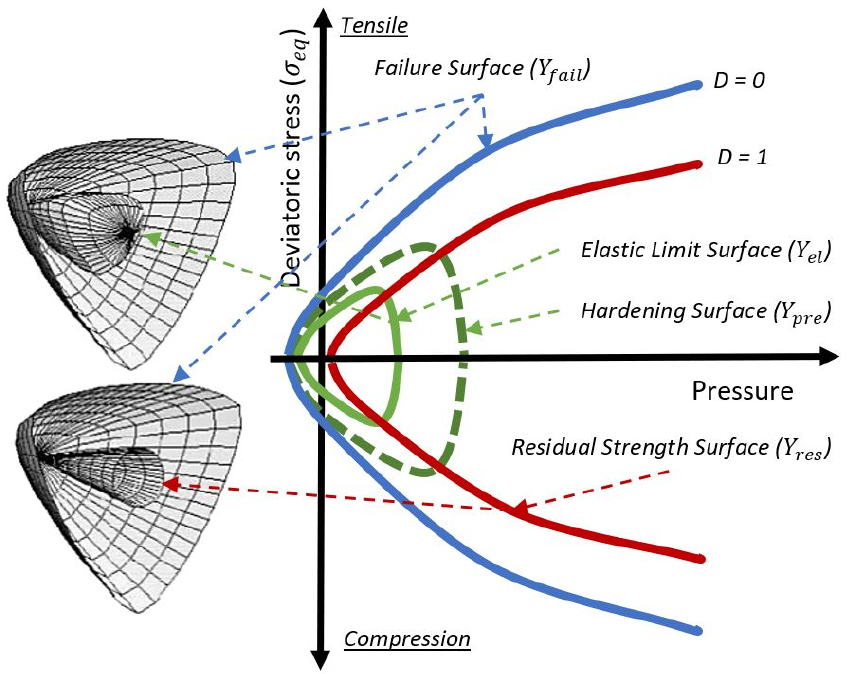
Fig. 4.
Three limited surfaces in deviatoric stress space from Kang and Jang (2020) that modified after Riedel (2009).
For this study, the RHT concrete model (Riedel, 2004), implemented in AUTODYN, was chosen to assess the caprock effects. The RHT material parameters used in Lagrange elements are presented in Table 1. Due to the vagueness of the caprock blasting configuration, several assumptions were made including a simplified and uniformly laid parallel caprock layer on top of the soft rock layer that both were made up of homogeneous rock mass. In this regard, rock-like material with compressive strengths of 35 MPa and 140 MPa, sand and Ammonium Nitrate Fuel Oil (ANFO) from the ANSYS material library has been used to represent base rock and caprock layer, stemming and a main explosive for the simulation.
Table 1.
P-alpha EOS for RHT concrete from AUTODYN material library (ANSYS, 2023)
Table 2.
Equation of State of ANFO from AUTODYN material library (ANSYS, 2023)
ANFO was selected to be applied to the numerical model in AUTODYN with Jones-Wilkins-Lee (JWL) model. The equation of state (EOS) of JWL is expressed in Equation 1 and the explosive material parameters for the JWL model are tabulated in Table 2.
The geometry of the surface bench blasting model
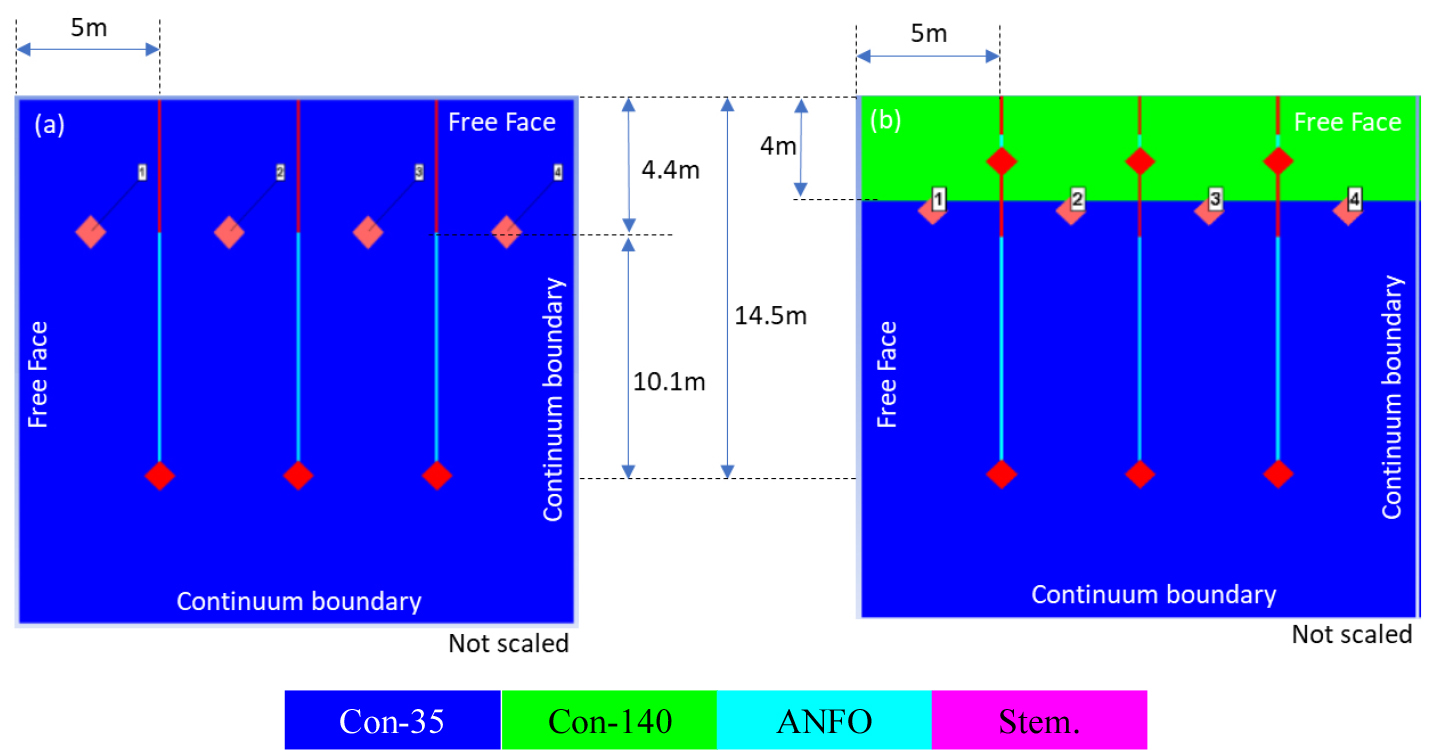
2D bench blasting models with blast holes of 127 mm in diameter have been developed to simulate the effects of caprock on the blasting performance. In Fig. 5, the left represents a bench blast design without a caprock layer. With a total design width of 20 m, burdens are evenly spaced at 5 m intervals. Parameters such as blasthole stemming, column charge and bottom charge lengths are used from Langefors’ method. The stemming length is 4.4 m, while column and bottom charges are treated as homogeneous charges due to software limitations, measuring 10.1 m long. Consequently, the total blasthole depth is 14.5 m. All explosives are detonated simultaneously to prevent excessive model distortion. The concrete with 35 MPa and 140 MPa from the AUTODYN material library has been utilized to represent base rock and caprock layers. Furthermore, sand and ANFO are introduced as a stemming material and a primary explosive, respectively. Four sensors, located roughly 2.5 m from the blast holes and 4.4 m below the surface, measure the effective strain of blasted rock material.
Simulation design
In the simulation of pocket charge blasting, the preliminary design was configured with the length of the pocket charge established at 80 cm. This measurement equates to 20 per cent of the caprock layer's overall thickness, which is 4 metres.
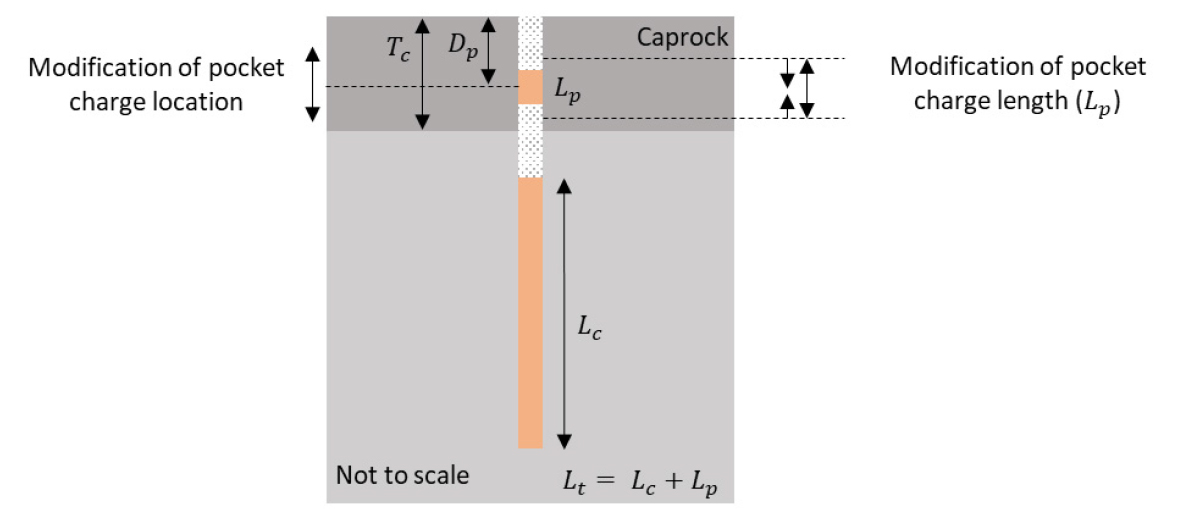
Modification of the pocket charge length
The depth of the pocket charge (Dp), defined as the distance from the surface to the centre of the pocket charge, is initially set at 2 meters below the surface. Subsequently, the pocket charge length (Lp) is increased incrementally by 5 per cent of the total caprock layer thickness. The simulation will be replicated by varying the pocket charge length (Lp) from 5 to 35 per cent of the caprock layer's thickness. In this context, it should be noted that the explosive charge length (Lc) in the underlying softer rock layer is also adjusted to maintain the same total charge length (Lt) for all simulations. The simulation specifications are shown in Table 3 and Fig. 6.
Table 3.
Modification process of the pocket charge length
| Lp (m) | Lp/Tc (%) | changes in Lc (m) | |
| CR+PC05 | 0.2 | 5 | 0.2 |
| CR+PC10 | 0.4 | 10 | 0.4 |
| CR+PC15 | 0.6 | 15 | 0.6 |
| CR+PC20 | 0.8 | 20* | 0.8 |
| CR+PC25 | 1 | 25 | 1 |
| CR+PC30 | 1.2 | 30 | 1.2 |
| CR+PC35 | 1.6 | 35 | 1.6 |
Modification of the pocket charge position
As a series of simulations proceed, the amount of pocket charge may be optimised in terms of well-developed fragmentation. However, it is important to reflect slight alterations of pocket charge location to define the optimal caprock blast model for better fragmentation and fewer environmental issues. Therefore, the location will be adjusted based on the thickness of the caprock with a 5 per cent increment. The location of the caprock blast model in this modelling process will start at 1.6 m from the bottom of the caprock layer where 1.6 m comprises 40% of the caprock layer thickness. Then, the location will shift upward by 0.2 m or 5 % of the thickness. Simulation in other locations was not conducted as they pose a higher possibility to cause flyrock or interruption with the bottom charge.
Analysis Results
Effects of caprock
Two simulation outcomes with and without the caprock layer in Fig. 7 represent how the confinement from the caprock negatively affects the fragment development in an open pit bench blast. Although the blasted area with caprock and no pocket charge showed more damage in the caprock layer at first glance, the image of the damaged area at 30 ms illustrates that fragmentation was poorly developed in the area.
In this study, the perfect plastic strain area was counted as the damaged area. The proportion of the damaged area was determined as the damaged area over the initial area of material excluding explosive expansion-induced areas by ANFO as shown in Eq. 2.
Although the damage percentages between the two simulations initially appeared similar, the detrimental effect of the caprock is discernible in Fig. 7, illustrating the difference in damage percentages between the absence of caprock (nCR) and the presence of caprock without a pocket charge (CR+nPC). Within the first 10 milliseconds after the initiation, the damage in the nCR scenario escalated swiftly from zero to approximately 37%, while in the CR+nPC scenario, it only reached 14.5% during the same period and remained almost constant until the end of the simulation, with only around a 5 per cent increment. Conversely, the damage in the nCR simulation continued to progress, reaching up to 49% of the material. This resulted in approximately a 30 per cent difference in damage between the two simulations at the end of the simulation period. The per cent of damage in nCR and CR+nPC is demonstrated in Fig. 8.
Effects of pocket charge
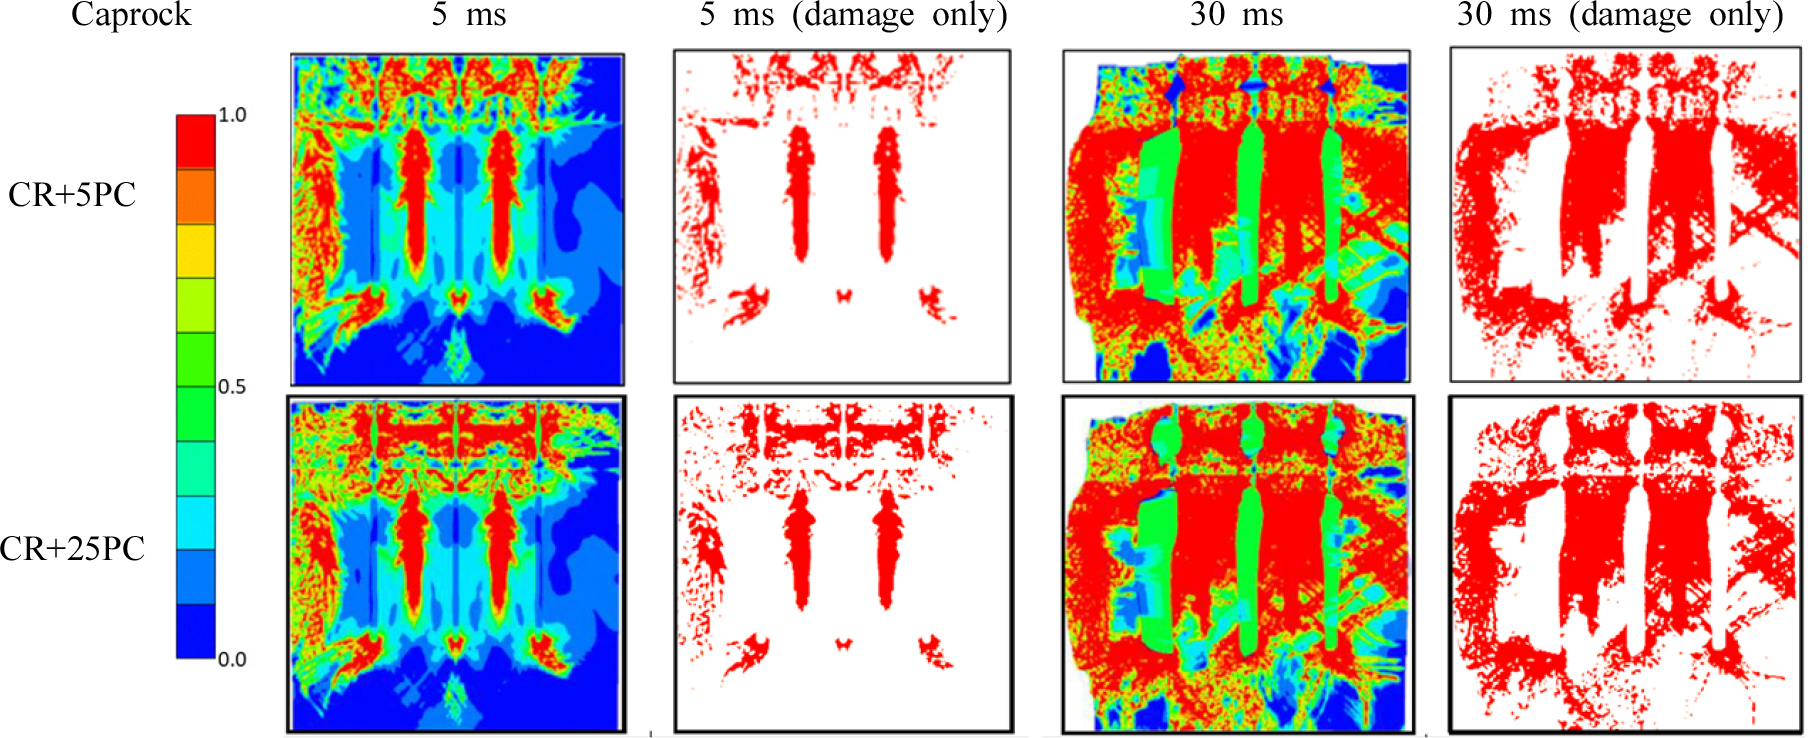
To mitigate the negative effect of the caprock layer on bench blast, the pocket charge is often applied in the mining industry owing to its dramatic fragment improvement in the caprock layer as seen in Fig. 3. The simulation results showed that the application of even 5 per cent of pocket charge made significant damage in the layer compared to the outcomes without pocket charge as seen in Fig. 9. Nevertheless, some parts of the caprock around the crest and toe areas of the bench were still unfragmented and merely heaved, producing some large size of boulders.
Fig. 10 describes the damage percentage of all damaged areas of various pocket charge lengths in the caprock layer over time. The percentage of damage from each simulation increased with a similar increment of pocket charge amount. All results showed that a dramatic damage development occurred in the early stage of the blast until 15 ms after detonation. From that moment, the increment of damage stagnated drastically with only around a 1 per cent rise.
Since nCR had no pocket charge, the damage would not be detected during the early stage of the blasting operation. However, damage in the simulation significantly increased as described in the previous section. Although the damage percentage decreased by 30% due to the presence of the caprock layer, introducing a pocket charge raised the damage percentage by 15% with a 5% pocket charge and approximately 5% increase in damage with an additional 5% of the increase in the pocket charge amount resulting in a final damage percentage of 48.67% at the end of the simulation.
As analysed, the caprock layer acted as an inhibitor of blasting energy that caused the serious damage reduction. Although a 5% pocket charge (CR+PC05) made a considerable difference in terms of fragmentation development, the amount of explosive from it was insufficient to achieve a similar damage contribution from nCR simulation. Nevertheless, an amount of explosive greater than 25% pocket charge (CR+PC25) made the achievement possible artificially close to the natural damage from nCR as seen in Fig. 10. Detailed analysis results are shown in Table 4.
Table 4.
Damage area data of simulations
Effect of the pocket charge location
Analysis of the effectiveness of pocket charge amount from the previous section revealed that a 25% pocket charge gave the most effective outcomes close to the original blast without the caprock layer. Nonetheless, optimisation of the blast model is still required as modification of the charge location might improve damage development with better fragmentation outcomes. To conduct the analysis, a 20% pocket charge configuration (PC20) is chosen and the percentage of damage has been calculated at 20 ms after the blast. The simulation results demonstrated in Fig. 11 show that the effects of the pocket charge location are neglectable as the difference between the lowest to highest damage outcomes was only 1.5%. It shows that fragmentation development became stagnated with similar increments level regardless of pocket charge locations.
To determine the best pocket charge design for the caprock layered geology, the occurrence of flyrock hazards should be considered. Due to an inability of measuring the flyrock effect from the model, an empirical analysis named the Scaled Depth of Burial (SDOB) was utilized to calculate the ideal location of the pocket charge in the caprock layer to achieve a balance between good fragmentation and flyrock and noise control. The SDOB can be calculated as below:
Where St represents the stemming length in m, ∅ is the explosive diameter in mm, is the density of the explosive in g/cc and is the charge length as a multiple of the borehole diameter.
The SDOB is the relation between the charge confinement and its amount that affects cratering effects at the collar region of the blasthole. Theoretically, the creator and bench blast have different mechanisms and applications of the SDOB to the bench blast must be done with the proper post-blast analysis to verify the SDOB values in the bench blast. Nonetheless, the SDOB was adopted in this study as it easily evaluates the contribution of buried explosives in the upper section of the blast hole to potential material ejections. As demonstrated in Fig. 12, the projection of ejected rock fragmentation velocity, the range of projected material and the probability of flyrock will be increased when the SDOB of charge is decreased. An SDOB ratio between 0.92 and 1.4 is considered the most suitable design for ideal cratering to achieve an optimal balance between good fragmentation and less flyrock and noise problems (Stiehr and Dean, 2011). The variables for calculating SDOB are listed in Table 5.
Table 5.
Scaled Depth of Burial (SDOB) variables for each model
| Model | nCR | CR | |||||||
| nPC | PC5 | PC10 | PC15 | PC20 | PC25 | PC30 | PC35 | ||
| Lp | 0 | 0 | 0.2 | 0.4 | 0.6 | 0.8 | 1.0 | 1.2 | 1.4 |
| St | 4.4 | 4.4 | 1.9 | 1.8 | 1.7 | 1.6 | 1.5 | 1.4 | 1.2 |
| SDOB | 2.05 | 2.05 | 1.03 | 0.99 | 0.95 | 0.91 | 0.87 | 0.83 | 0.79 |
The SDOB of the cases of non-caprock (nCR) and caprock (CR) with different percentages of explosive were calculated and demonstrated in Fig. 13. SDOB values with caprock and pocket charge indicated that the balance between fragmentation and flyrock will be optimised with the caprock blast model from CR+PC05 to CR+PC20. However, the percentage of damage in those models from simulation outcomes was lower and cannot be amended to achieve the target damage distribution. On the other hand, the model from CR+PC25 to CR+PC35 had a higher probability of flyrock and dust events due to their shorter stemming length than the former models.
Considering improved material fragmentation in the caprock layer and less required charge length, CR+PC25 was chosen to conduct further analysis of comparing SDOB of different charge locations. From the simulation, CR+PC25_15 (caprock + 25% of pocket charge located at 15% of caprock length from the boundary of caprock and the main rock or the centre of pocket charge at 3.6 m below the surface) was the lowest pocket charge location where the SDOB value was 1.44 that might impose less flyrock effect with less favourable fragmentation development. SDOB values from CR+25_20 to CR+25_40 (the centre of the pocket charge location from 3.2 m (CR+25_20) to 2.4 m (CR+25_40) were in an ideal SDOB range between 1.36 and 1.03. To sum up, from this SDOB range, CR+PC25_40 was selected as the optimal caprock blast model with the lowest possible value of 1.03 which provides favourable caprock breakage with minimal flyrock occurrence.
Conclusion
Surface mining operations consistently grapple with boulder-related issues emanating from caprock layers, which are hard strata situated above softer rock mass layers. The presence of caprock significantly impedes the productivity of mines by restricting efficient energy use for rock breakage, and it also introduces safety risks. The study aimed to determine an optimal bench blast design when caprock is present and the primary conclusions of the study are summarised below:
1) A bench blast model was created, drawing upon the Langefors method, and caprock effects were scrutinised using AUTODYN, a software application for nonlinear dynamic modelling. The Scaled Depth of Burial (SDOB) method was employed to inspect the effects of pocket charge placement.
2) The outcomes of the AUTODYN simulation showed that introducing a pocket charge significantly improved fragmentation in the caprock layer. It shows that even a 5 per cent pocket charge length made a considerable damage development in the caprock layer with a 15% improvement. Additional 5% damage growth with every 5% of pocket charge amount increment up to approximately 49% of damage at 30 ms after detonation. However, the pocket charge amount over 25% showed minimal advancement in terms of damage development with only less than 0.5% difference compared to the simulations with 30% and 35% of pocket charge.
3) The simulation was composed of three distinct phases, each involving different amounts and placements of pocket charges within the caprock layer. The results indicated that, in the absence of caprock, damage escalated to roughly 49%, but this rate dropped to 30% when caprock was factored into the simulation. The introduction of pocket charges enhanced the damage by 15% while utilizing merely 5% of the entire explosive charge. An analysis using the Scaled Depth of Burial (SDOB) method pointed to the optimal placement for a 25% pocket charge being 1.6m from the base of the caprock, thereby minimizing environmental impact.
4) In conclusion, the optimal caprock bench blast model was determined to be a 25% pocket charge situated at the 40% level up from the caprock base. This configuration ensures maximized fragmentation while concurrently minimizing environmental disruption.


